> ## Documentation Index
> Fetch the complete documentation index at: https://docs.caplena.com/llms.txt
> Use this file to discover all available pages before exploring further.
# Data Tab Overview
> Everything you can do in Caplena's Data Tab, from editing to exporting
The **Data Tab** is where you view, clean, and manage your dataset in Caplena. Whether you are preparing data for analysis, fixing errors, or customizing the table view, you stay in control without re-uploading files.
## Accessing the Data Tab
To get started, click on **Data** in the sidebar. You'll see an interactive table showing the data you uploaded.
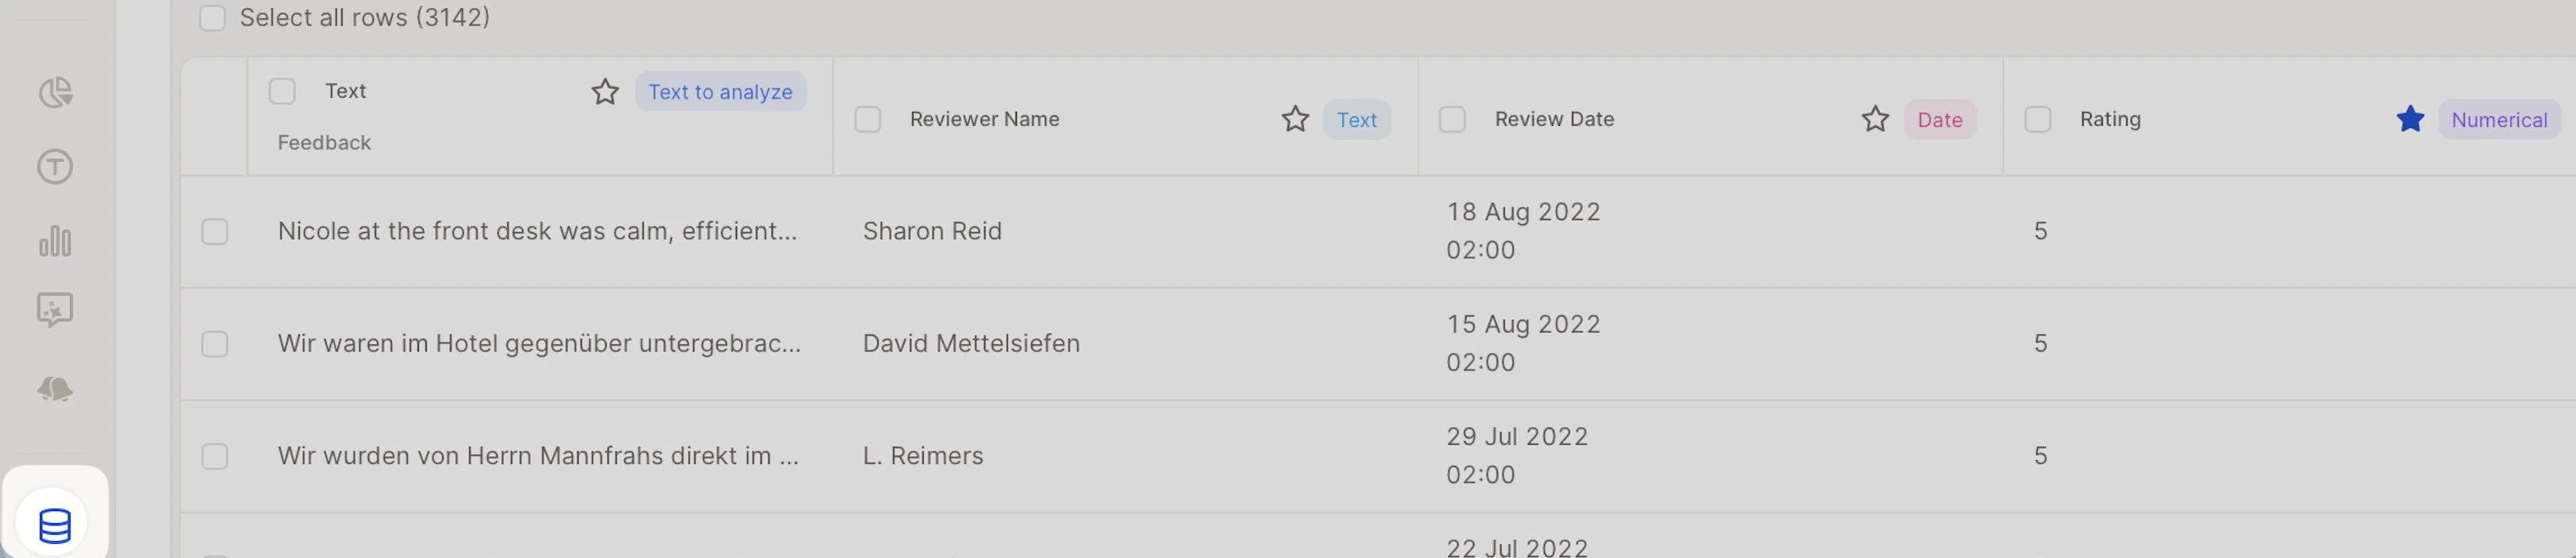 The Data Tab includes:
* **Toolbar** – Filter, edit, and customize your dataset
* **Table View** – See rows (responses) and columns (data fields)
* **Checkboxes** – Select rows for bulk actions
## Viewing column details
To inspect a column's full data profile, click on any column header. A Column Details panel will open with two sections.
The Data Tab includes:
* **Toolbar** – Filter, edit, and customize your dataset
* **Table View** – See rows (responses) and columns (data fields)
* **Checkboxes** – Select rows for bulk actions
## Viewing column details
To inspect a column's full data profile, click on any column header. A Column Details panel will open with two sections.
 **Settings**
* **Name** — edit the column's display name directly
* **Favorite** — pin this column to the top of dropdowns and filter menus for faster access
* **Default score** — set this column as the primary scoring reference across your project
* **Sensitive** — mark the column as containing sensitive data (available on auxiliary columns). Only users with the **View sensitive columns** permission can see the toggle, see sensitive columns in project data, and export them. See [object-level permissions](/settings-administration/permissions-deep-dive/object-level-permissions) for details.
**Column content** *(read-only)*
* **Column Ref** — the internal ID
* **Data Type** — e.g. Numerical, Text
* **Populated rows** — how many rows have a value in this column
* **Unique Values Count** — number of distinct values
* **Last Value Added** — timestamp of the most recent entry
* **Data Source** — where the data originated
* **# of Empty Rows** — rows with no value in this column
* **Sample values** — a quick preview of actual entries
If a column shows a high number of empty rows, check whether the data was imported correctly or whether a Smart Column needs to be re-run.
## Favoriting and hiding columns
These features help you focus on relevant fields without permanently changing your dataset.
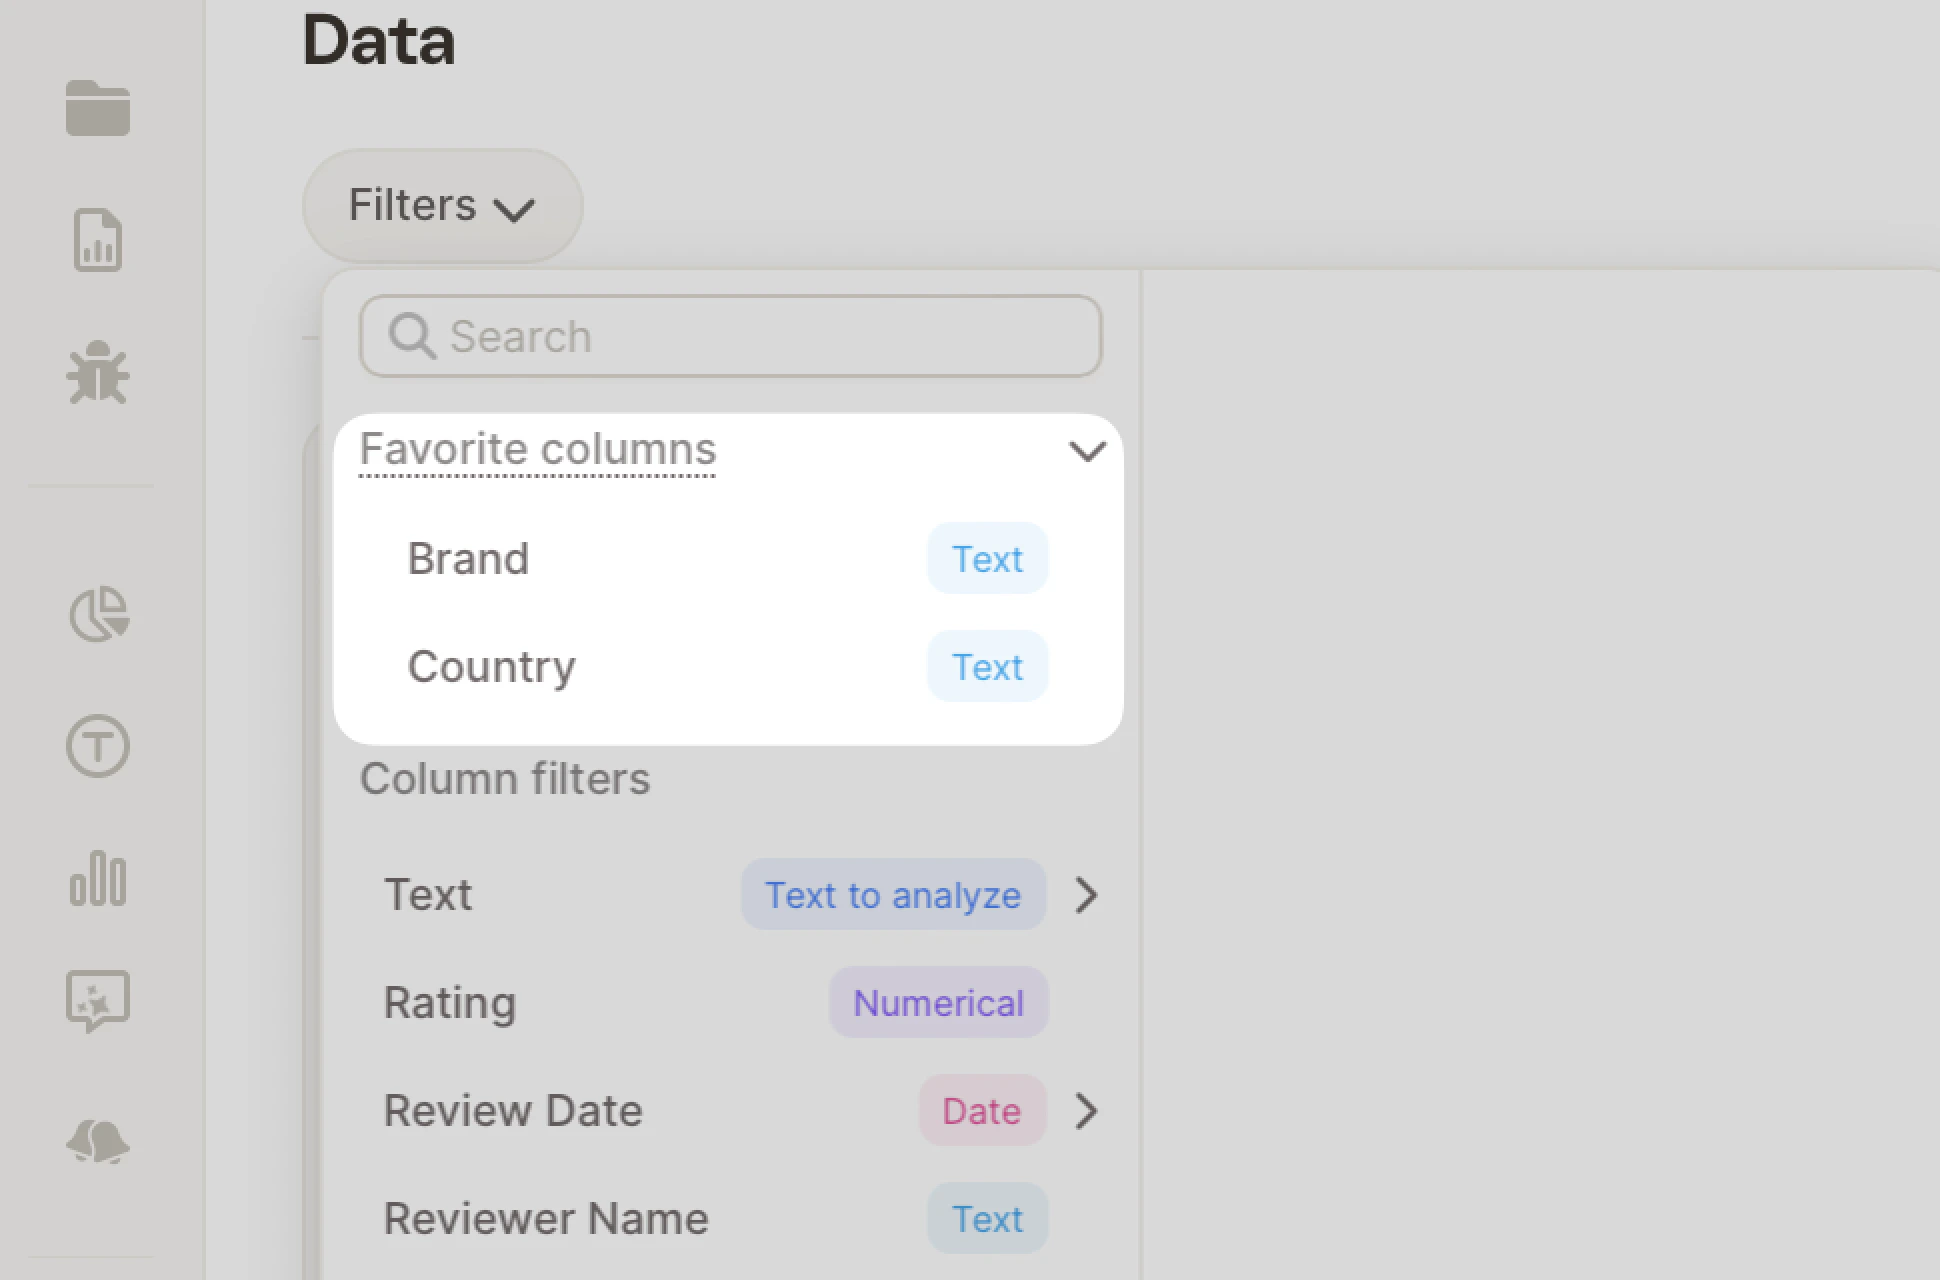
### Favorite columns
Mark a column as a favorite to pin it to the top of dropdown menus (e.g. when selecting filters), making it quicker to find and use. This is especially helpful when working with many columns.
**Settings**
* **Name** — edit the column's display name directly
* **Favorite** — pin this column to the top of dropdowns and filter menus for faster access
* **Default score** — set this column as the primary scoring reference across your project
* **Sensitive** — mark the column as containing sensitive data (available on auxiliary columns). Only users with the **View sensitive columns** permission can see the toggle, see sensitive columns in project data, and export them. See [object-level permissions](/settings-administration/permissions-deep-dive/object-level-permissions) for details.
**Column content** *(read-only)*
* **Column Ref** — the internal ID
* **Data Type** — e.g. Numerical, Text
* **Populated rows** — how many rows have a value in this column
* **Unique Values Count** — number of distinct values
* **Last Value Added** — timestamp of the most recent entry
* **Data Source** — where the data originated
* **# of Empty Rows** — rows with no value in this column
* **Sample values** — a quick preview of actual entries
If a column shows a high number of empty rows, check whether the data was imported correctly or whether a Smart Column needs to be re-run.
## Favoriting and hiding columns
These features help you focus on relevant fields without permanently changing your dataset.
### Favorite columns
Mark a column as a favorite to pin it to the top of dropdown menus (e.g. when selecting filters), making it quicker to find and use. This is especially helpful when working with many columns.
 When you mark a column as a favorite, it will appear at the top of dropdown menus (e.g., when selecting filters), making it quicker to find and use.
 ### Hide columns
* Click **Show/Hide Columns**
* Uncheck any column you don't want visible
* The table updates immediately
### Hide columns
* Click **Show/Hide Columns**
* Uncheck any column you don't want visible
* The table updates immediately
 ## Marking columns as sensitive
Use **Sensitive** to restrict who can see a column's values. Sensitive columns are hidden from rows, coding views, and filters for any user who doesn't have the `Projects View Sensitive Columns` permission — even if they otherwise have access to the project.
Typical uses include hiding free-text fields that may contain personal data, internal identifiers, or commercially sensitive responses, while still letting analysts work with the rest of the dataset.
To mark a column as sensitive:
Click the column header to open **Column Details**.
Toggle **Sensitive** on.
To remove the sensitive flag, open the same **Column Details** panel and toggle **Sensitive** off. The column's values become visible again to all users with project access.
The toggle is only available on auxiliary columns (not on text-to-analyze columns) and only visible to users with the `Projects View Sensitive Columns` permission. See [Object-level permissions](/settings-administration/permissions-deep-dive/object-level-permissions) for how to grant it.
Marking a column sensitive controls visibility only. To irreversibly remove personal data from text values, use [Anonymization](/get-started/project-settings/anonymization) at upload time.
## Editing text fields
You can edit responses or text rows directly from the table, which is helpful for fixing typos or clarifying entries.
Click the field you want to change
Make your edits
Press **Enter**, or click outside the cell to save
## Marking columns as sensitive
Use **Sensitive** to restrict who can see a column's values. Sensitive columns are hidden from rows, coding views, and filters for any user who doesn't have the `Projects View Sensitive Columns` permission — even if they otherwise have access to the project.
Typical uses include hiding free-text fields that may contain personal data, internal identifiers, or commercially sensitive responses, while still letting analysts work with the rest of the dataset.
To mark a column as sensitive:
Click the column header to open **Column Details**.
Toggle **Sensitive** on.
To remove the sensitive flag, open the same **Column Details** panel and toggle **Sensitive** off. The column's values become visible again to all users with project access.
The toggle is only available on auxiliary columns (not on text-to-analyze columns) and only visible to users with the `Projects View Sensitive Columns` permission. See [Object-level permissions](/settings-administration/permissions-deep-dive/object-level-permissions) for how to grant it.
Marking a column sensitive controls visibility only. To irreversibly remove personal data from text values, use [Anonymization](/get-started/project-settings/anonymization) at upload time.
## Editing text fields
You can edit responses or text rows directly from the table, which is helpful for fixing typos or clarifying entries.
Click the field you want to change
Make your edits
Press **Enter**, or click outside the cell to save
 Each verbatim edit uses 1 credit, as Caplena reprocesses the entry to update insights like sentiment and topics.
## Deleting rows and columns
Use this when you want to permanently remove data you no longer need.
### Delete rows
* Use the checkboxes to select rows
* Click **Delete Rows** in the toolbar
* Confirm deletion
Each verbatim edit uses 1 credit, as Caplena reprocesses the entry to update insights like sentiment and topics.
## Deleting rows and columns
Use this when you want to permanently remove data you no longer need.
### Delete rows
* Use the checkboxes to select rows
* Click **Delete Rows** in the toolbar
* Confirm deletion
 ### Delete columns
* Click **Delete Columns**
* Choose the column to remove
* Confirm the action
### Delete columns
* Click **Delete Columns**
* Choose the column to remove
* Confirm the action
 If you're unsure about removing something, consider hiding the column instead.
## Filtering the table
Use filters to focus on a specific subset of data (e.g., only 5-star reviews or responses from a certain region).
Click **Filters** in the toolbar
Select a column
Choose a condition
Apply the filter
If you're unsure about removing something, consider hiding the column instead.
## Filtering the table
Use filters to focus on a specific subset of data (e.g., only 5-star reviews or responses from a certain region).
Click **Filters** in the toolbar
Select a column
Choose a condition
Apply the filter
.gif) ## Adding or replacing data
Keep your dataset up to date without having to re-upload everything from scratch.
## Adding or replacing data
Keep your dataset up to date without having to re-upload everything from scratch.
 ### Add rows
Appends new data to your existing dataset without affecting existing rows — perfect for continuously adding new feedback over time.
[Read the full article on Adding Data](/data-project-management/adding-replacing-data/append-rows-to-an-existing-project)
### Replace rows
Useful when correcting or updating existing fields.
[Read the full article on Replacing Data](/data-project-management/adding-replacing-data/add-replace-columns-in-your-dataset)
## Exporting data
Once you've cleaned or filtered your dataset, you can export it for further analysis or reporting. Options include exporting the full dataset or only the filtered data.
[Read the full article on Exporting Data](/data-project-management/data-export/exporting-your-data)
### Add rows
Appends new data to your existing dataset without affecting existing rows — perfect for continuously adding new feedback over time.
[Read the full article on Adding Data](/data-project-management/adding-replacing-data/append-rows-to-an-existing-project)
### Replace rows
Useful when correcting or updating existing fields.
[Read the full article on Replacing Data](/data-project-management/adding-replacing-data/add-replace-columns-in-your-dataset)
## Exporting data
Once you've cleaned or filtered your dataset, you can export it for further analysis or reporting. Options include exporting the full dataset or only the filtered data.
[Read the full article on Exporting Data](/data-project-management/data-export/exporting-your-data)