> ## Documentation Index
> Fetch the complete documentation index at: https://docs.caplena.com/llms.txt
> Use this file to discover all available pages before exploring further.
# File Import
> How to prepare and upload your dataset to Caplena.
### Preparing Your File
Format your file using these guidelines before uploading:
 * Each **row** should represent one individual record, a respondent, review, or feedback entry
* The **first row** must contain **column headers** (variable names or question labels)
If your file has more than one header row (e.g. the first row with variable names, the second with descriptions), merge them into one row or remove the extra before uploading.
**Accepted formats:** `.xls` `.xlsx` `.csv` `.txt` `.spss` `.sav`
Password-protected Excel files (`.xls`, `.xlsx`) can't be uploaded. Remove the password in Excel (**File → Info → Protect Workbook → Encrypt with Password**, then clear the password and save) before uploading.
***
### Understanding Column Types
#### Text-to-Analyze (TTA)
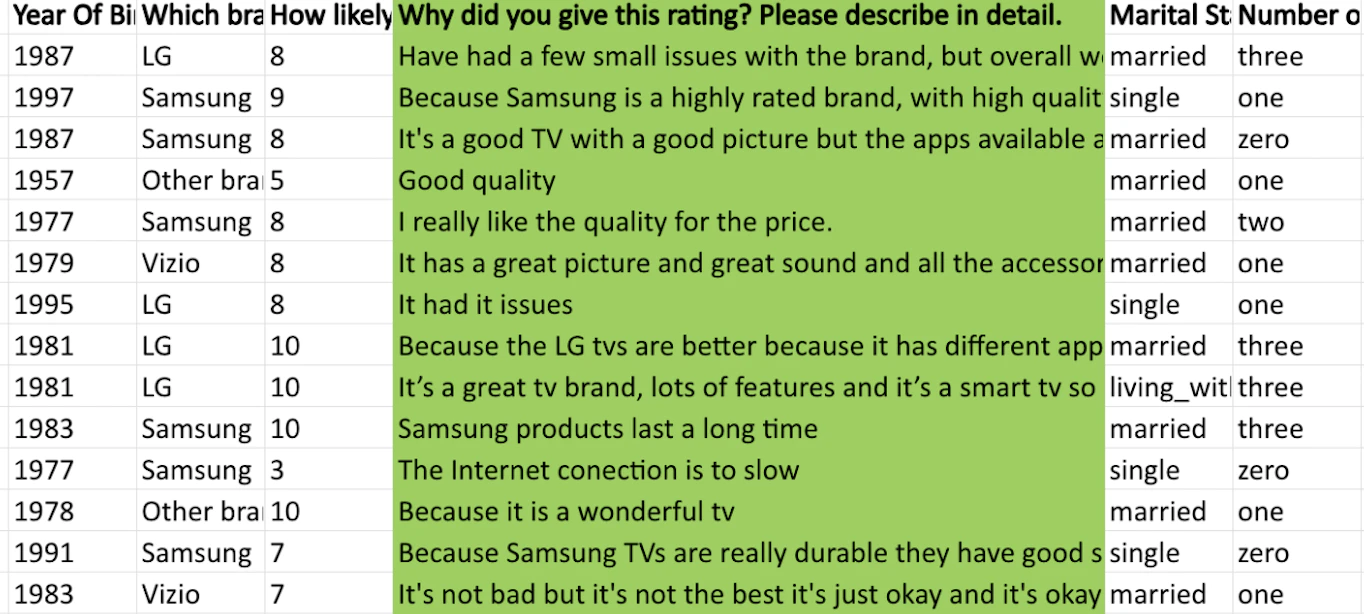
This is where Caplena applies its AI analysis. TTA columns should contain open-ended responses — customer feedback, survey comments, or reviews.
In the screenshot above, the green-highlighted *"Reason for Rating"* column is a TTA column. Caplena supports up to **25 open-text columns** per project, each treated individually — no need to create separate projects per question.
Keep each TTA column clear and focused. Avoid combining unrelated responses unless they logically belong together.
#### Other Columns
Other columns provide context but are not analyzed by AI. They're optional but highly recommended to enrich your analysis.
Age, gender, customer segment, region
Response ID, user ID
NPS score, star ratings, yes/no answers
Use these columns to **segment** responses by group or **filter** feedback during fine-tuning and reporting.
You're only billed for TTA columns, other columns are free.
***
### Working with Dates
Include a date column if you'd like to filter or trend results over time.
* Each **row** should represent one individual record, a respondent, review, or feedback entry
* The **first row** must contain **column headers** (variable names or question labels)
If your file has more than one header row (e.g. the first row with variable names, the second with descriptions), merge them into one row or remove the extra before uploading.
**Accepted formats:** `.xls` `.xlsx` `.csv` `.txt` `.spss` `.sav`
Password-protected Excel files (`.xls`, `.xlsx`) can't be uploaded. Remove the password in Excel (**File → Info → Protect Workbook → Encrypt with Password**, then clear the password and save) before uploading.
***
### Understanding Column Types
#### Text-to-Analyze (TTA)
This is where Caplena applies its AI analysis. TTA columns should contain open-ended responses — customer feedback, survey comments, or reviews.
In the screenshot above, the green-highlighted *"Reason for Rating"* column is a TTA column. Caplena supports up to **25 open-text columns** per project, each treated individually — no need to create separate projects per question.
Keep each TTA column clear and focused. Avoid combining unrelated responses unless they logically belong together.
#### Other Columns
Other columns provide context but are not analyzed by AI. They're optional but highly recommended to enrich your analysis.
Age, gender, customer segment, region
Response ID, user ID
NPS score, star ratings, yes/no answers
Use these columns to **segment** responses by group or **filter** feedback during fine-tuning and reporting.
You're only billed for TTA columns, other columns are free.
***
### Working with Dates
Include a date column if you'd like to filter or trend results over time.
 **Supported formats:**
| Format | Example |
| ------------ | ---------- |
| `YYYY-MM-DD` | 2022-01-30 |
| `DD.MM.YYYY` | 30.01.2022 |
| `DD/MM/YYYY` | 30/01/2022 |
US-style dates (`MM/DD/YYYY`) are not supported. Convert them to a day-first format before uploading.
Caplena automatically converts valid formats to ISO (`YYYY-MM-DD`) and supports timestamps (e.g. `2022-01-30 14:35:00`).
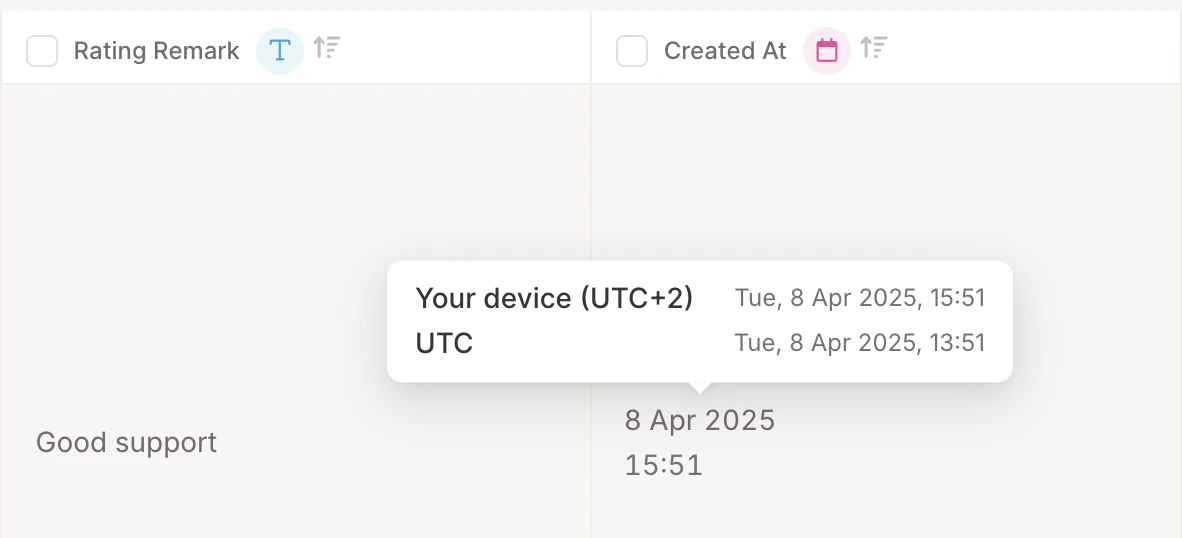
**Timezone handling**
Date-time values without a specified timezone are interpreted as **UTC**. In the Data tab, hovering over a date-time entry shows the original UTC value; individual row views display time in **your local timezone**. If your data includes a timezone, Caplena will respect it.
**Supported formats:**
| Format | Example |
| ------------ | ---------- |
| `YYYY-MM-DD` | 2022-01-30 |
| `DD.MM.YYYY` | 30.01.2022 |
| `DD/MM/YYYY` | 30/01/2022 |
US-style dates (`MM/DD/YYYY`) are not supported. Convert them to a day-first format before uploading.
Caplena automatically converts valid formats to ISO (`YYYY-MM-DD`) and supports timestamps (e.g. `2022-01-30 14:35:00`).
**Timezone handling**
Date-time values without a specified timezone are interpreted as **UTC**. In the Data tab, hovering over a date-time entry shows the original UTC value; individual row views display time in **your local timezone**. If your data includes a timezone, Caplena will respect it.
 ***
### Merging Multiple Columns
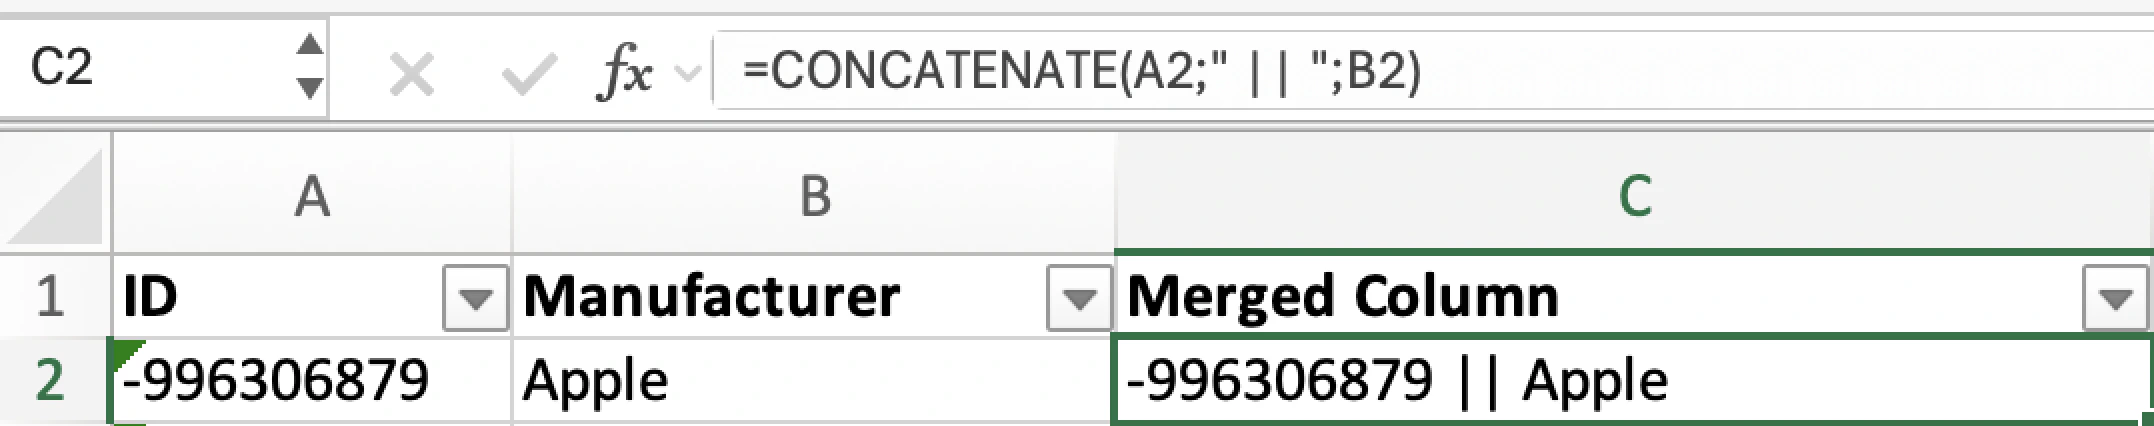
If several columns relate to the same question, merge them before uploading using Excel's `CONCATENATE` function:
```excel theme={null}
=CONCATENATE(A2," || ",B2)
```
The `||` separator helps Caplena identify content from different sources. Add as many cells as needed.
***
### Merging Multiple Columns
If several columns relate to the same question, merge them before uploading using Excel's `CONCATENATE` function:
```excel theme={null}
=CONCATENATE(A2," || ",B2)
```
The `||` separator helps Caplena identify content from different sources. Add as many cells as needed.
 You can also use Smart Columns inside Caplena after import, no need to modify your file.
***
### Uploading Your File
Drag and drop your file into the upload box, or click to browse your device. Caplena will guide you through the next steps automatically.
### Finalizing Your Data Setup
After uploading, Caplena takes you to the **Organize Your Data** screen to configure everything before analysis begins.
**1. Select the right columns**
Use the checkboxes to include the columns you need. Use the filter bar to quickly find specific columns in larger datasets.
Make sure your main TTA column is selected — it's required for AI analysis.
**2. Understand column types**
Each column is automatically detected and categorized:
| Type | Description |
| --------------------- | -------------------------------------------------- |
| TTA (Text to Analyze) | The main open-text field(s) Caplena will analyze |
| Text Columns | Fields used for filtering, like age or region |
| Date Columns | Used for time-based filtering or trend analysis |
| Numerical Columns | Numeric data such as employee count or survey wave |
**3. Preview your data**
Check the sample data shown for each column to confirm formatting — especially for dates and numeric values.
**4. Finalize**
* **Validate** – confirm and continue
* **Back** – re-upload your file if something looks wrong
* **Cancel** – exit without saving changes
You can also use Smart Columns inside Caplena after import, no need to modify your file.
***
### Uploading Your File
Drag and drop your file into the upload box, or click to browse your device. Caplena will guide you through the next steps automatically.
### Finalizing Your Data Setup
After uploading, Caplena takes you to the **Organize Your Data** screen to configure everything before analysis begins.
**1. Select the right columns**
Use the checkboxes to include the columns you need. Use the filter bar to quickly find specific columns in larger datasets.
Make sure your main TTA column is selected — it's required for AI analysis.
**2. Understand column types**
Each column is automatically detected and categorized:
| Type | Description |
| --------------------- | -------------------------------------------------- |
| TTA (Text to Analyze) | The main open-text field(s) Caplena will analyze |
| Text Columns | Fields used for filtering, like age or region |
| Date Columns | Used for time-based filtering or trend analysis |
| Numerical Columns | Numeric data such as employee count or survey wave |
**3. Preview your data**
Check the sample data shown for each column to confirm formatting — especially for dates and numeric values.
**4. Finalize**
* **Validate** – confirm and continue
* **Back** – re-upload your file if something looks wrong
* **Cancel** – exit without saving changes