> ## Documentation Index
> Fetch the complete documentation index at: https://docs.caplena.com/llms.txt
> Use this file to discover all available pages before exploring further.
# Creating Reports
> Learn how to create a report in Caplena to generate powerful visual insights.
Once your data is analyzed, the **Reports** section helps bring your insights to life through dynamic, easy-to-read visualizations. Whether you're monitoring customer satisfaction, identifying key trends, or preparing presentations, Caplena reports make storytelling with data simple and impactful.
## What you can do with reports
* Visualize your data using charts, graphs, and summaries.
* Share compelling insights with your team or stakeholders.
* Track performance and feedback over time.
Think of reports as the final chapter of your analysis, where raw data becomes actionable insight.
## Step 1: Access the Reports section
Open your Caplena project.
Click on the **Reports** tab in the top navigation bar.
Select the **New Report** button in the top-right corner.
 ## Step 2: Choose a report template
Caplena lets you choose between two report types at the top of the "Create new report" screen:
* **Static** – A point-in-time report
* **Over time** – A report comparing results across periods (e.g., months, weeks)
Once you select the report type, you can choose how you want to start building your report.
## Step 2: Choose a report template
Caplena lets you choose between two report types at the top of the "Create new report" screen:
* **Static** – A point-in-time report
* **Over time** – A report comparing results across periods (e.g., months, weeks)
Once you select the report type, you can choose how you want to start building your report.
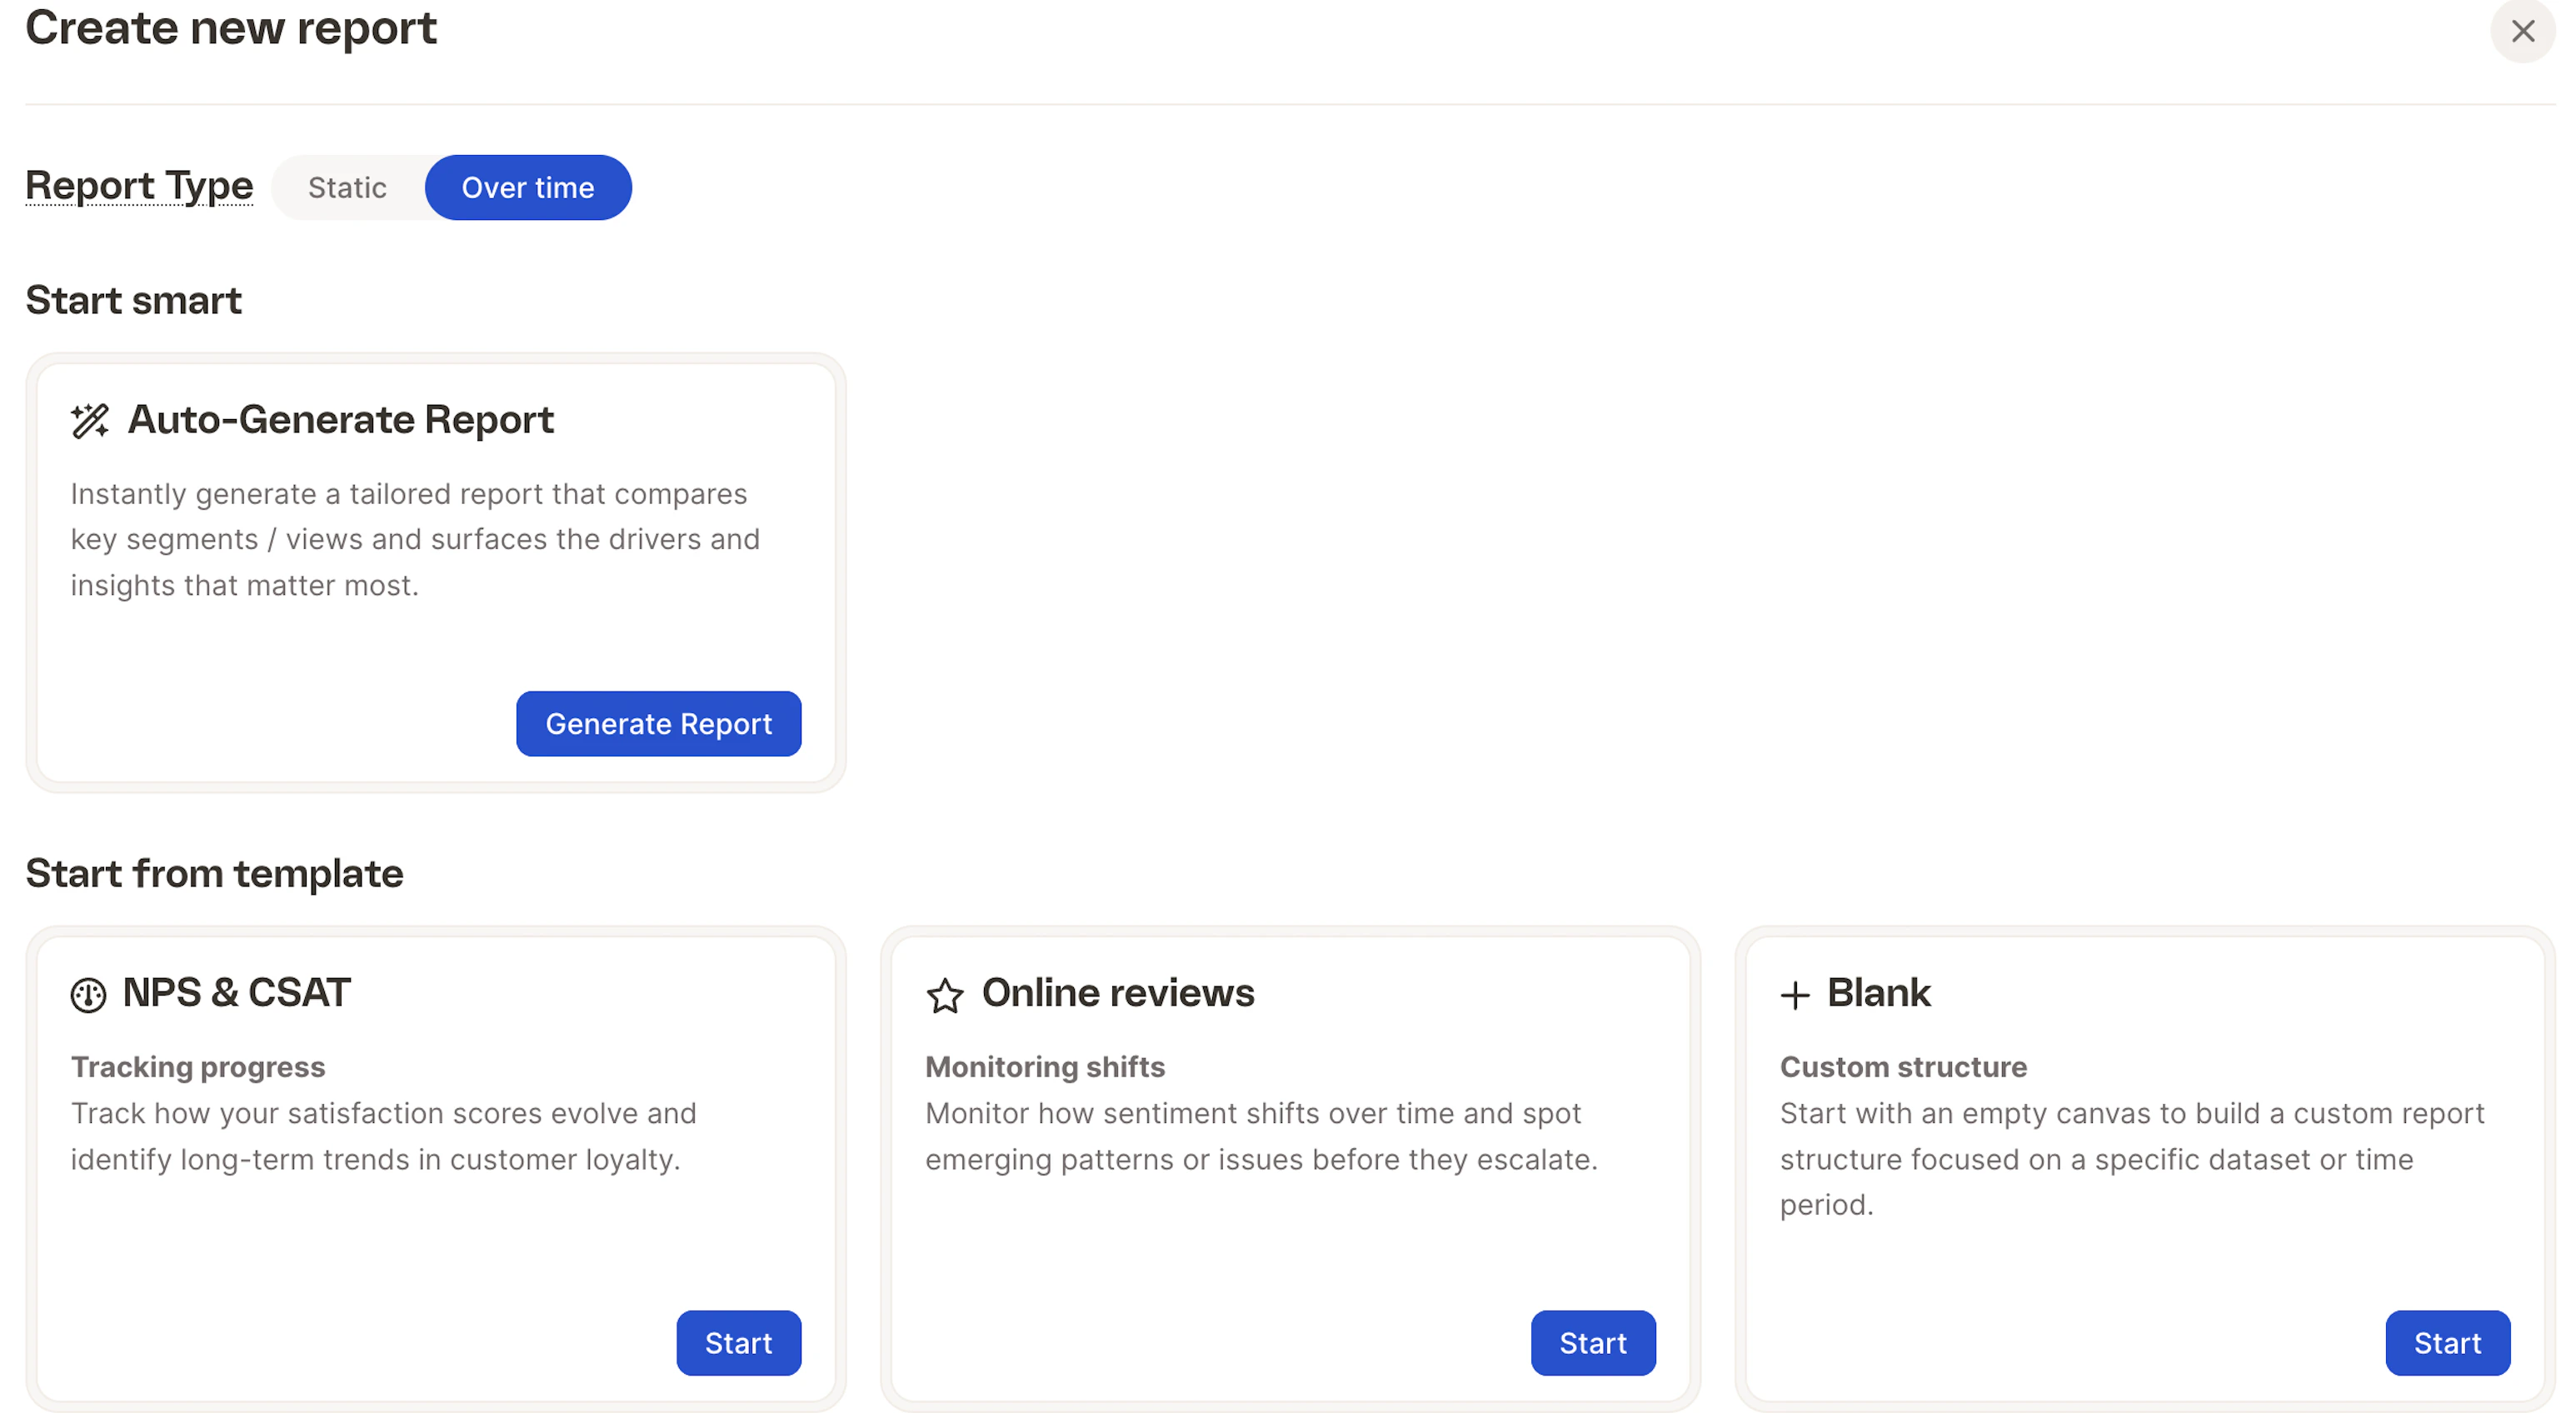 **✨ Auto-Generate Report**
Generates a tailored report instantly based on your dataset. Caplena highlights key segments, meaningful differences, and the main drivers behind sentiment and experience. Click **Generate Report** to create it automatically.
Depending on the report type you selected, you can pick a template that matches your goal:
| Template | Best For |
| :----------------- | :------------------------------------------------------------------------------- |
| **NPS & CSAT** | Tracking satisfaction over time and identifying long-term trends in loyalty. |
| **Online Reviews** | Monitoring shifts in sentiment and spotting emerging themes or issues. |
| **Blank** | Full flexibility — start with an empty structure and define everything yourself. |
If you want to analyze how customer satisfaction evolved after a product update, choose **NPS & CSAT** under the **Over time** tab.
Click **Start** under your preferred template to continue.
Some templates may limit or customize the types of charts available based on the focus of the report.
## Step 3: Configure your report
Let's walk through the configuration using the **NPS Over Time** template as an example.
**✨ Auto-Generate Report**
Generates a tailored report instantly based on your dataset. Caplena highlights key segments, meaningful differences, and the main drivers behind sentiment and experience. Click **Generate Report** to create it automatically.
Depending on the report type you selected, you can pick a template that matches your goal:
| Template | Best For |
| :----------------- | :------------------------------------------------------------------------------- |
| **NPS & CSAT** | Tracking satisfaction over time and identifying long-term trends in loyalty. |
| **Online Reviews** | Monitoring shifts in sentiment and spotting emerging themes or issues. |
| **Blank** | Full flexibility — start with an empty structure and define everything yourself. |
If you want to analyze how customer satisfaction evolved after a product update, choose **NPS & CSAT** under the **Over time** tab.
Click **Start** under your preferred template to continue.
Some templates may limit or customize the types of charts available based on the focus of the report.
## Step 3: Configure your report
Let's walk through the configuration using the **NPS Over Time** template as an example.
 ### Basic info
* **Report Name** — e.g., *Q2 2025 NPS Trend Report*
* **Description** *(optional)* — brief goal or context, e.g., *"Tracking NPS after April onboarding update"*
### Data columns
* **Score** — numeric field (e.g., *NPS Score*, *Satisfaction Rating*)
* **Open-Text** — explanation field (e.g., *Why did you give this score?*)
* **Date** *(optional)* — for time-based charts (e.g., *Survey Completion Date*)
## Step 4: Generate and customize your report
Click **Generate Report** to instantly create your first draft. From there, you can:
* Drag & drop visual elements.
* Apply filters by segments like country, product, or sentiment.
* Add titles and annotations to tell a clear story.
### Basic info
* **Report Name** — e.g., *Q2 2025 NPS Trend Report*
* **Description** *(optional)* — brief goal or context, e.g., *"Tracking NPS after April onboarding update"*
### Data columns
* **Score** — numeric field (e.g., *NPS Score*, *Satisfaction Rating*)
* **Open-Text** — explanation field (e.g., *Why did you give this score?*)
* **Date** *(optional)* — for time-based charts (e.g., *Survey Completion Date*)
## Step 4: Generate and customize your report
Click **Generate Report** to instantly create your first draft. From there, you can:
* Drag & drop visual elements.
* Apply filters by segments like country, product, or sentiment.
* Add titles and annotations to tell a clear story.