> ## Documentation Index
> Fetch the complete documentation index at: https://docs.caplena.com/llms.txt
> Use this file to discover all available pages before exploring further.
# Filters, segments, and views
> Narrow your data with filters, compare groups side by side with segments, and save tailored versions of a report with views.
Filters, segments, and views all change what a report shows, but each one answers a different question:
* **Filters** decide *which data* is included, for example only 1–2 star reviews, or only responses from Germany.
* **Segments** *split* the data into groups and show them side by side, for example results by gender, by brand, or by mobile carrier.
* **Views** *save* a combination of filters and segments as a tailored version of the report that you can share with a specific audience.
| | Filters | Segments | Views |
| - | - | - | - |
| **What it does** | Includes or excludes data | Compares groups side by side | Saves a tailored version of the report |
| **Example** | Only detractors | Promoters vs. passives vs. detractors | "Leadership summary – DACH" |
| **Where you set it up** | Filters bar in the report | Edit Master | Left sidebar of the report |
| **Changes the report structure?** | No | No | No — structure is always controlled by the Report Master |
A simple way to choose: if you want to *see less*, use a filter. If you want to *compare*, use segments. If you want to *keep or share* a setup, save it as a view.
## Filters
Filters narrow down the data that every insight element in the report uses. Common examples:
* **By brand** — compare customer experiences across products.
* **By country** — identify regional differences.
* **By rating** — focus on 1–2 star reviews to uncover pain points.
* **By date** — look at a specific period, such as the last 30 days.
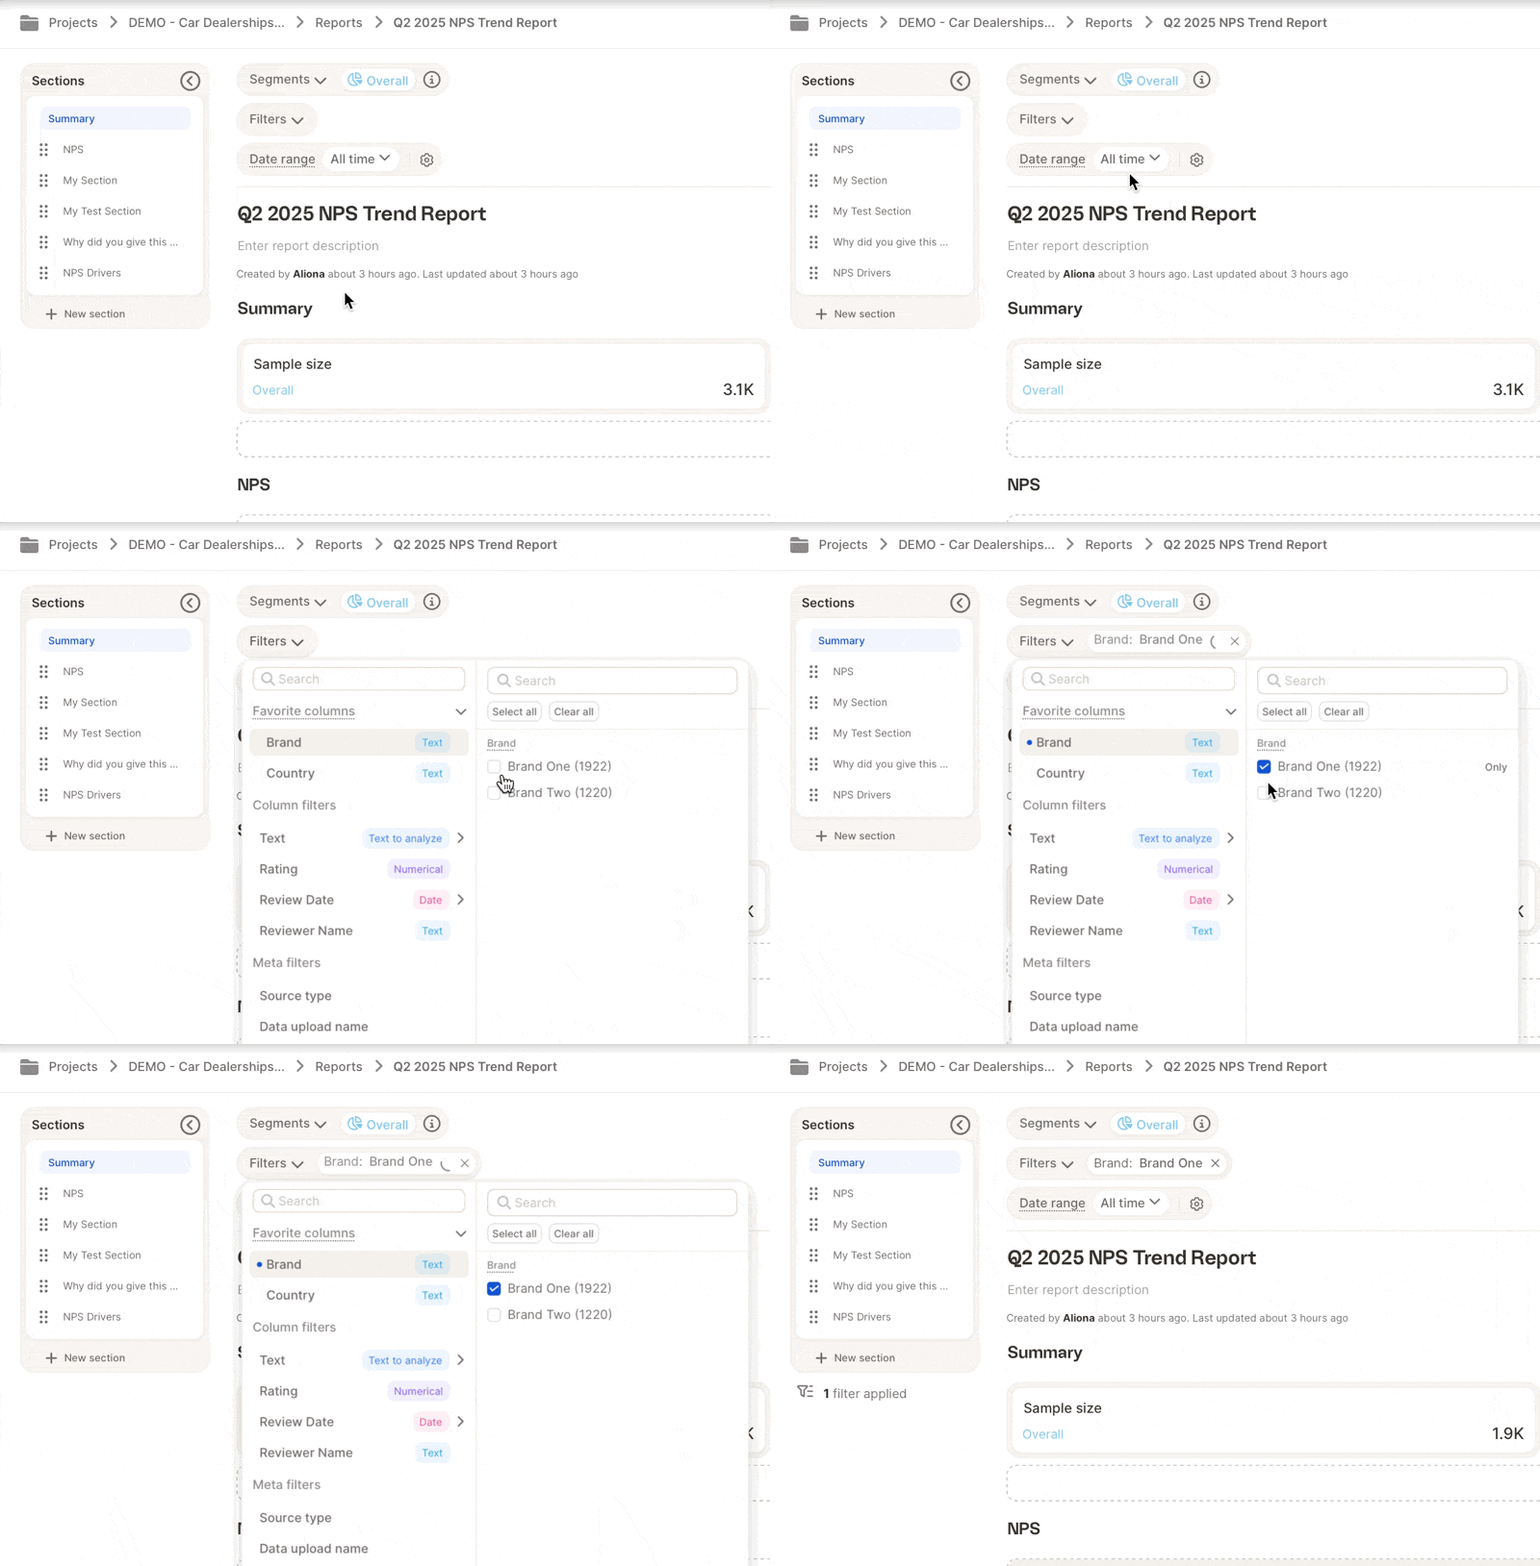 **Example:** Filter for 1–2 star reviews from Germany to understand local pain points.
### Date filters
Go to **Filters → Review Date** to limit the report to a time window. You can choose between two modes:
* **Rolling range** — updates automatically over time, for example "Last 12 months" or "Last 30 days".
* **Static range** — fixed start and end dates picked from the calendar.
Use a rolling range when the report should stay up to date on its own. For comparing periods and choosing intervals (day, week, month, quarter, year), see [Date range filter](/insight-and-reports/creating-and-customizing-reports/customizing-report#date-range-filter).
## Segments
Segments let you compare different cuts of your data side by side, such as Brand A vs. Brand B, or new vs. returning customers. Once segments are set, insight elements that support them show results for each segment separately.
Segments are built in the **Report Master**, so they're available in every view of the report.
### Create segments manually
Use this when you know exactly which variable you want to split by.
Open your report and switch to **Edit Master**.
Choose the variable you want to segment by, for example *Gender*.
Select the values you want as segments. You can create all of them in one go.
### Create segments with AI
Use this when you'd rather describe what you want in plain language.
Open your report and switch to **Edit Master**.
Select the **Overall** segment and click **Edit**.
Describe the segments you want, for example *"Create segments by country"*. Caplena looks at the additional variables in your dataset and generates the relevant segments automatically.
### Manage segments
Once segments exist, you can:
* **Rename** a segment by clicking its name in the editor.
* **Change the color** of a segment. Colors are assigned automatically, but you can match them to your branding.
* **Control visibility** of segments in specific views.
* **Duplicate** a segment when you need a variation of it.
## Views
Every report has two layers:
* The **Report Master** is the blueprint. This is where you add sections and insight elements, arrange the layout, and build segments. Any change here updates every view automatically.
* **Views** sit on top of the Master. A view can apply or lock filters, choose which segments are shown, and be shared on its own without sharing the rest of the report.
**Example:** Filter for 1–2 star reviews from Germany to understand local pain points.
### Date filters
Go to **Filters → Review Date** to limit the report to a time window. You can choose between two modes:
* **Rolling range** — updates automatically over time, for example "Last 12 months" or "Last 30 days".
* **Static range** — fixed start and end dates picked from the calendar.
Use a rolling range when the report should stay up to date on its own. For comparing periods and choosing intervals (day, week, month, quarter, year), see [Date range filter](/insight-and-reports/creating-and-customizing-reports/customizing-report#date-range-filter).
## Segments
Segments let you compare different cuts of your data side by side, such as Brand A vs. Brand B, or new vs. returning customers. Once segments are set, insight elements that support them show results for each segment separately.
Segments are built in the **Report Master**, so they're available in every view of the report.
### Create segments manually
Use this when you know exactly which variable you want to split by.
Open your report and switch to **Edit Master**.
Choose the variable you want to segment by, for example *Gender*.
Select the values you want as segments. You can create all of them in one go.
### Create segments with AI
Use this when you'd rather describe what you want in plain language.
Open your report and switch to **Edit Master**.
Select the **Overall** segment and click **Edit**.
Describe the segments you want, for example *"Create segments by country"*. Caplena looks at the additional variables in your dataset and generates the relevant segments automatically.
### Manage segments
Once segments exist, you can:
* **Rename** a segment by clicking its name in the editor.
* **Change the color** of a segment. Colors are assigned automatically, but you can match them to your branding.
* **Control visibility** of segments in specific views.
* **Duplicate** a segment when you need a variation of it.
## Views
Every report has two layers:
* The **Report Master** is the blueprint. This is where you add sections and insight elements, arrange the layout, and build segments. Any change here updates every view automatically.
* **Views** sit on top of the Master. A view can apply or lock filters, choose which segments are shown, and be shared on its own without sharing the rest of the report.
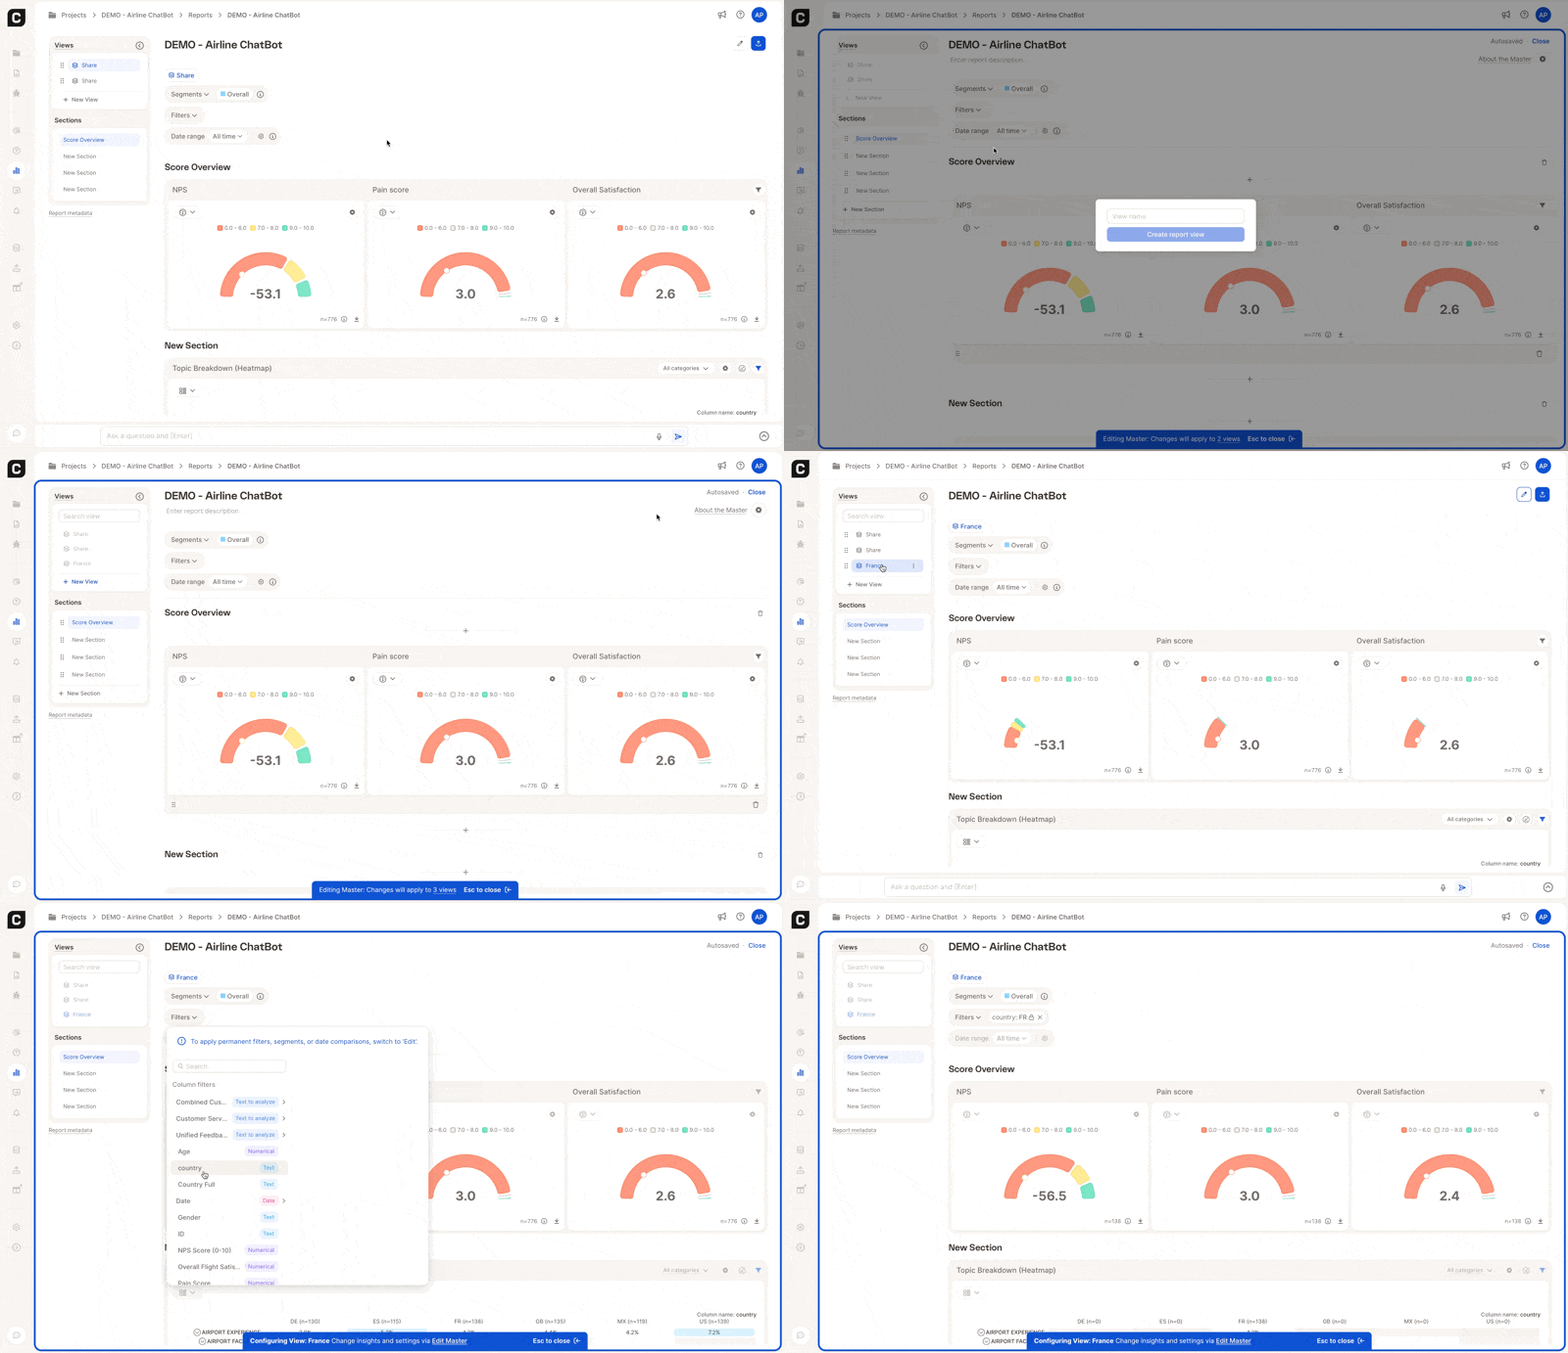 Views never change the structure of the report. Use the Master to change *how the report is built*, and views to change *what data it shows*.
Common ways to set up views:
* **By region:** DACH, North America
* **By customer group:** new vs. returning customers
* **By feedback type:** detractors, negative sentiment
* **By product or channel:** mobile app, checkout flow
* **By time period:** pre- and post-launch, last 30 days
* **By stakeholder:** leadership summary, product team
### Create a view
Open your report and click **+ New View** in the left sidebar.
Set the filters and choose the segments this view should show.
Give it a clear name that tells recipients what they're looking at, for example *"Report for Marketing – France"*.
Lock the filters if recipients shouldn't be able to remove or change them.
## Common tasks
Create a segment from that column. In **Edit Master**, select the variable (e.g. *Gender*), choose the values, and create the segments. Every insight element that supports segments will then show results per group. See [Create segments manually](#create-segments-manually).
Create a view, apply the filters for that team (e.g. their region), and **lock** the filters so they can't be removed. Then share only that view. See [Share filtered report views](/insight-and-reports/sharing-reports/sharing-reports#share-filtered-report-views).
Set the filters in a view. Recipients opening that view see the data already filtered. Lock the filters if you don't want them changed.
Choose the segments in the view itself. When recipients switch to that view, the charts are already split by those segments, with no setup needed on their side.
In the sharing modal, hide sensitive columns under **Visible columns**. Filters and segments that reference a hidden column still apply, but their configured values are redacted for recipients. See [Control which columns recipients can see](/insight-and-reports/sharing-reports/sharing-reports#control-which-columns-recipients-can-see).
Use the **Date range** and **Comparison** settings. See [Date range filter](/insight-and-reports/creating-and-customizing-reports/customizing-report#date-range-filter).
## Things to know
**PDF exports use the Report Master, not the view.** Filters set only on a saved view don't change what appears in the PDF. If the PDF needs to cover a specific segment or timeframe, set that filter on the Report Master before exporting. See [Export as PDF](/insight-and-reports/sharing-reports/sharing-reports#export-as-pdf).
* **Case limit applies to filters and segments.** If a filter or segment leaves too few responses, insights are hidden to protect respondent anonymity. See [Case Limit](/insight-and-reports/creating-and-customizing-reports/case-limit).
* **Agent respects the view's filters.** When Agent is enabled on a shared, filtered view, recipients can only ask questions about the data in that view.
* **Insights Radar is tied to the saved view.** If you change filters or segments away from the view's saved configuration, the Insights Radar rail is disabled until you reset to the saved view. See [Insights Radar](/insight-and-reports/insights-and-tasks/proactive-insights).
* **Alerts have their own filters.** You can scope an alert to a specific part of your data when you set it up. See [Setting Up Alerts](/insight-and-reports/alerts/setting-up-alerts).
## Related pages
Sections, insight elements, and date settings.
Share views internally, externally, or as an embed.
A walkthrough for report recipients.
Protect anonymity in small groups.
This documentation is built and hosted on [Mintlify](https://mintlify.com), a developer documentation platform.
Views never change the structure of the report. Use the Master to change *how the report is built*, and views to change *what data it shows*.
Common ways to set up views:
* **By region:** DACH, North America
* **By customer group:** new vs. returning customers
* **By feedback type:** detractors, negative sentiment
* **By product or channel:** mobile app, checkout flow
* **By time period:** pre- and post-launch, last 30 days
* **By stakeholder:** leadership summary, product team
### Create a view
Open your report and click **+ New View** in the left sidebar.
Set the filters and choose the segments this view should show.
Give it a clear name that tells recipients what they're looking at, for example *"Report for Marketing – France"*.
Lock the filters if recipients shouldn't be able to remove or change them.
## Common tasks
Create a segment from that column. In **Edit Master**, select the variable (e.g. *Gender*), choose the values, and create the segments. Every insight element that supports segments will then show results per group. See [Create segments manually](#create-segments-manually).
Create a view, apply the filters for that team (e.g. their region), and **lock** the filters so they can't be removed. Then share only that view. See [Share filtered report views](/insight-and-reports/sharing-reports/sharing-reports#share-filtered-report-views).
Set the filters in a view. Recipients opening that view see the data already filtered. Lock the filters if you don't want them changed.
Choose the segments in the view itself. When recipients switch to that view, the charts are already split by those segments, with no setup needed on their side.
In the sharing modal, hide sensitive columns under **Visible columns**. Filters and segments that reference a hidden column still apply, but their configured values are redacted for recipients. See [Control which columns recipients can see](/insight-and-reports/sharing-reports/sharing-reports#control-which-columns-recipients-can-see).
Use the **Date range** and **Comparison** settings. See [Date range filter](/insight-and-reports/creating-and-customizing-reports/customizing-report#date-range-filter).
## Things to know
**PDF exports use the Report Master, not the view.** Filters set only on a saved view don't change what appears in the PDF. If the PDF needs to cover a specific segment or timeframe, set that filter on the Report Master before exporting. See [Export as PDF](/insight-and-reports/sharing-reports/sharing-reports#export-as-pdf).
* **Case limit applies to filters and segments.** If a filter or segment leaves too few responses, insights are hidden to protect respondent anonymity. See [Case Limit](/insight-and-reports/creating-and-customizing-reports/case-limit).
* **Agent respects the view's filters.** When Agent is enabled on a shared, filtered view, recipients can only ask questions about the data in that view.
* **Insights Radar is tied to the saved view.** If you change filters or segments away from the view's saved configuration, the Insights Radar rail is disabled until you reset to the saved view. See [Insights Radar](/insight-and-reports/insights-and-tasks/proactive-insights).
* **Alerts have their own filters.** You can scope an alert to a specific part of your data when you set it up. See [Setting Up Alerts](/insight-and-reports/alerts/setting-up-alerts).
## Related pages
Sections, insight elements, and date settings.
Share views internally, externally, or as an embed.
A walkthrough for report recipients.
Protect anonymity in small groups.
This documentation is built and hosted on [Mintlify](https://mintlify.com), a developer documentation platform.