> ## Documentation Index
> Fetch the complete documentation index at: https://docs.caplena.com/llms.txt
> Use this file to discover all available pages before exploring further.
# Insight Elements Values Explained
> Why topic totals may exceed category totals
## Why topic totals inside a category can be higher than the category total
In Caplena, **all chart values and percentages are calculated on a respondent level** — every number represents how many respondents mentioned something, not how many topic assignments exist.
Because of this, it is expected and correct that:
 > The sum of all topics inside a category can be higher than the category's total.
## How counts in charts work
**Category counts** — the number of respondents who mentioned any topic in that category. Each respondent is counted once, even if their answer matches multiple topics inside the category.
**Topic counts** — the number of respondents who mentioned that specific topic. If a respondent mentions multiple topics, they count once for each.
This is why topic totals can exceed the category total: topic counts include multiple mentions from the same respondent, while the category count includes each respondent only once. This is intentional and reflects the true underlying data structure.
## Example: "PRODUCT QUALITY"
> The sum of all topics inside a category can be higher than the category's total.
## How counts in charts work
**Category counts** — the number of respondents who mentioned any topic in that category. Each respondent is counted once, even if their answer matches multiple topics inside the category.
**Topic counts** — the number of respondents who mentioned that specific topic. If a respondent mentions multiple topics, they count once for each.
This is why topic totals can exceed the category total: topic counts include multiple mentions from the same respondent, while the category count includes each respondent only once. This is intentional and reflects the true underlying data structure.
## Example: "PRODUCT QUALITY"
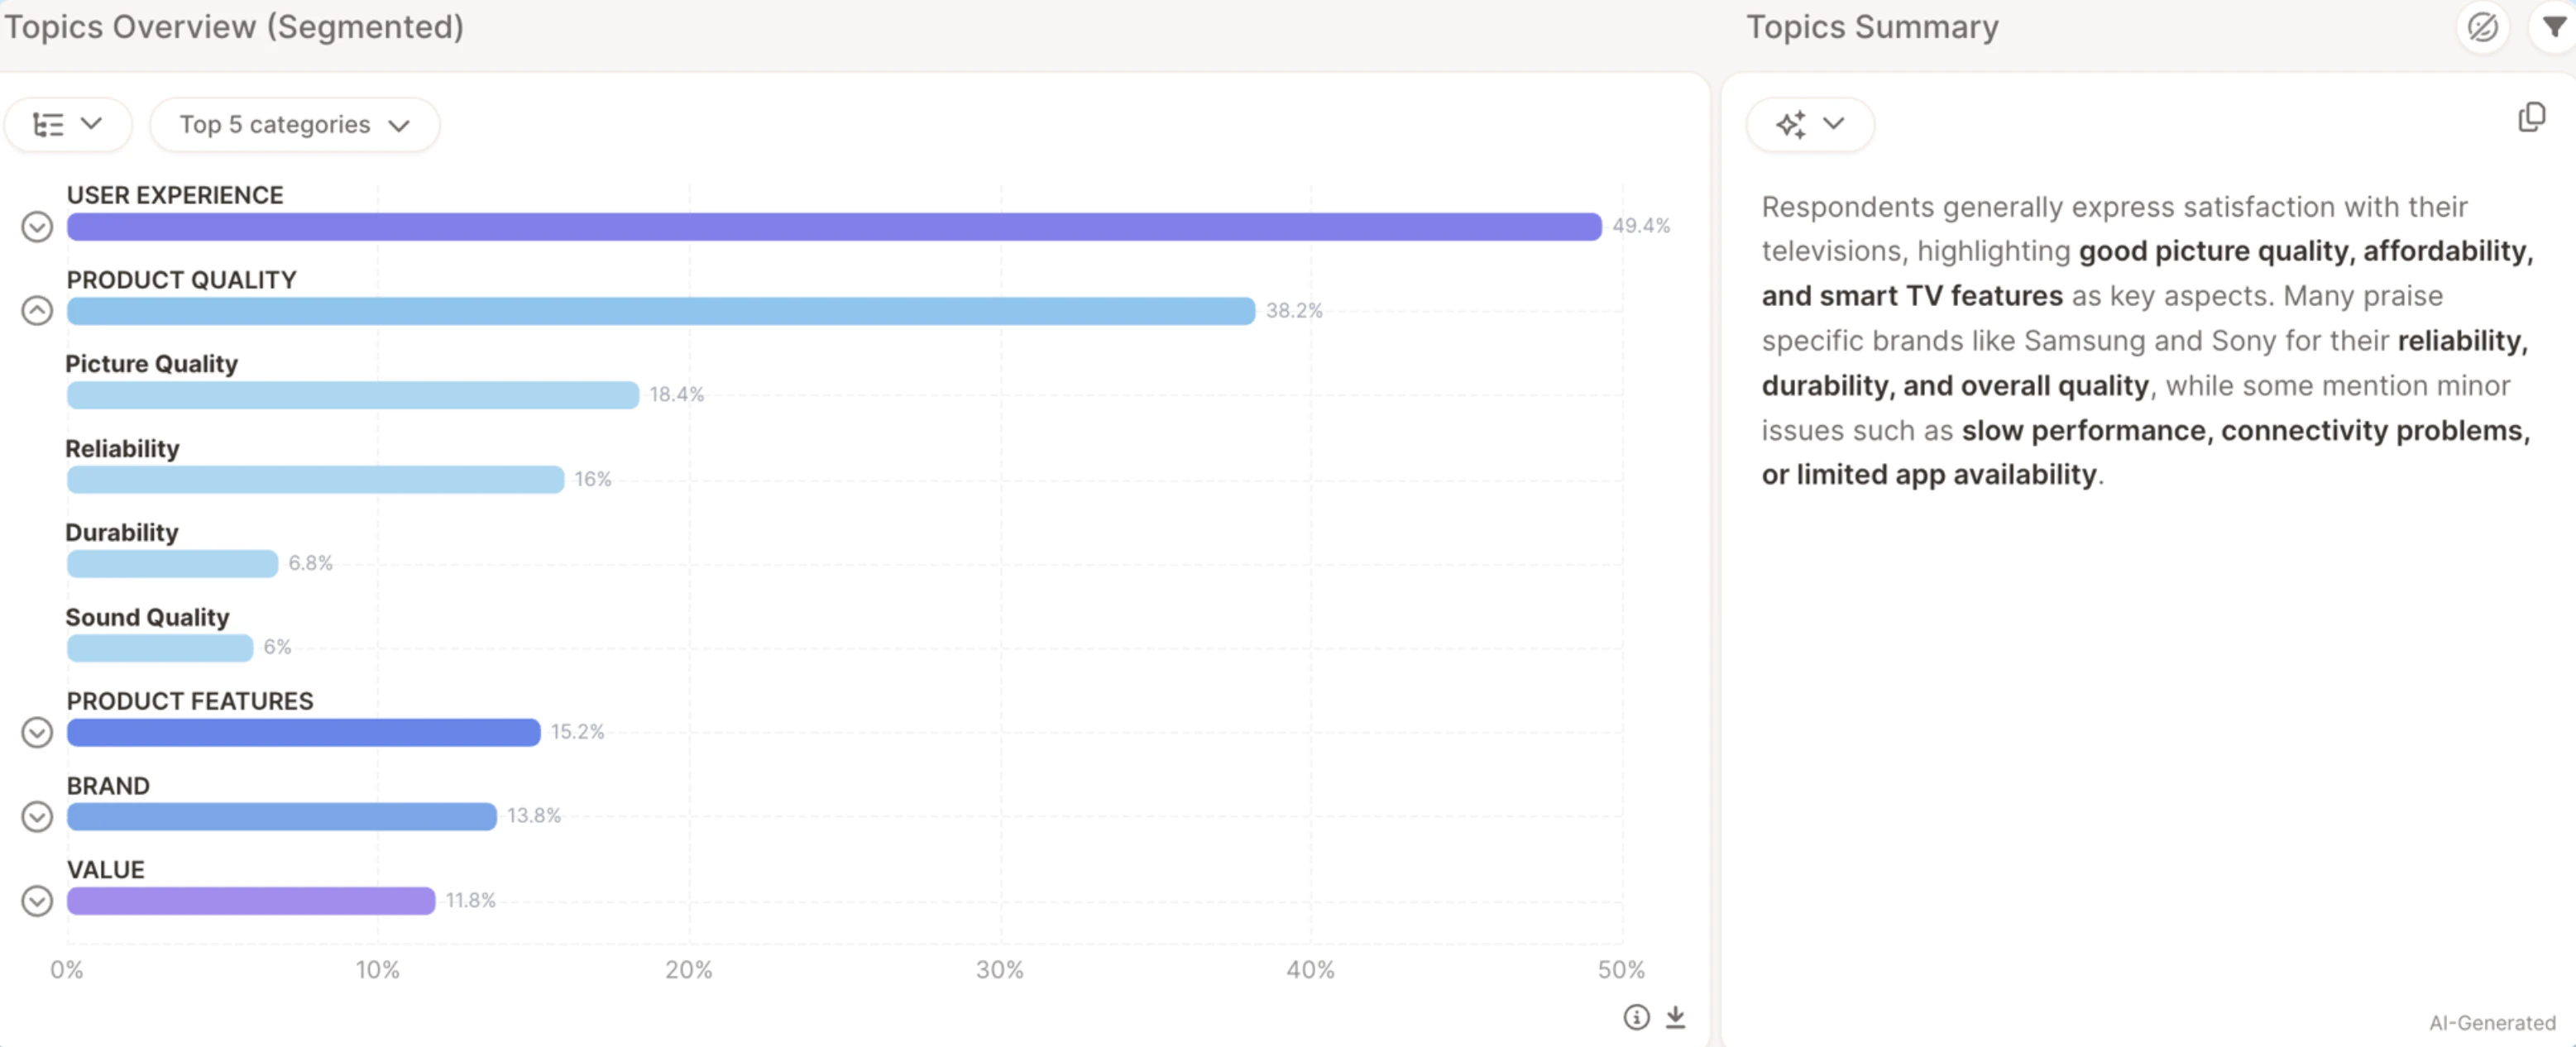
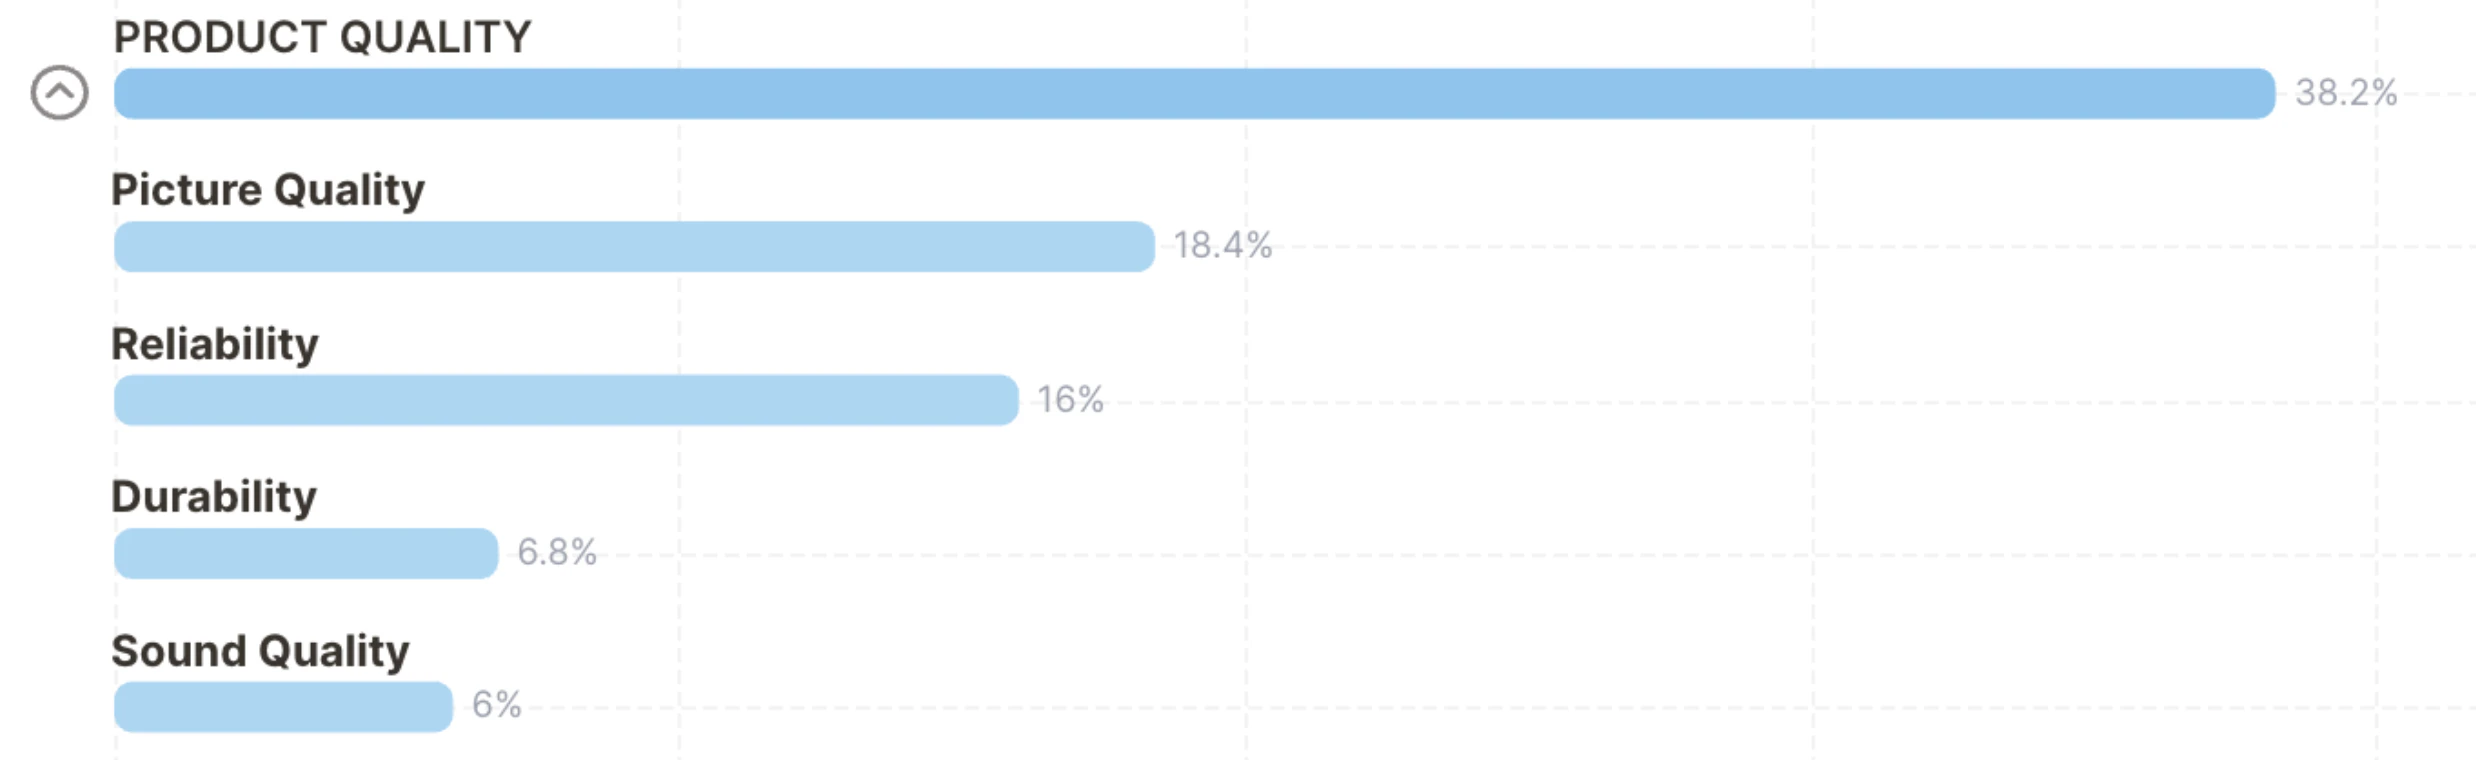 **Category: PRODUCT QUALITY — 38.2%**
This means 38.2% of all respondents mentioned something about Product Quality. Each respondent is counted once, even if their answer covers several quality aspects.
**Topics inside PRODUCT QUALITY:**
* Picture Quality — 18.4%
* Reliability — 16%
* Durability — 6.8%
* Sound Quality — 6%
Adding these up exceeds 38.2% — and that's correct, because a single respondent can match multiple topics within the same category.
**Real-world example**
**Category: PRODUCT QUALITY — 38.2%**
This means 38.2% of all respondents mentioned something about Product Quality. Each respondent is counted once, even if their answer covers several quality aspects.
**Topics inside PRODUCT QUALITY:**
* Picture Quality — 18.4%
* Reliability — 16%
* Durability — 6.8%
* Sound Quality — 6%
Adding these up exceeds 38.2% — and that's correct, because a single respondent can match multiple topics within the same category.
**Real-world example**
 Caplena assigned this response three topics:
* **Picture Quality** (under PRODUCT QUALITY)
* **Sound Quality** (under PRODUCT QUALITY)
* **Accessories** (under PRODUCT FEATURES)
Numerically, this respondent counts:
* **1** for Picture Quality
* **1** for Sound Quality
* **1 total** for PRODUCT QUALITY (the category)
They do not count twice in the category even though they triggered two topics within it.
Caplena assigned this response three topics:
* **Picture Quality** (under PRODUCT QUALITY)
* **Sound Quality** (under PRODUCT QUALITY)
* **Accessories** (under PRODUCT FEATURES)
Numerically, this respondent counts:
* **1** for Picture Quality
* **1** for Sound Quality
* **1 total** for PRODUCT QUALITY (the category)
They do not count twice in the category even though they triggered two topics within it.