> ## Documentation Index
> Fetch the complete documentation index at: https://docs.caplena.com/llms.txt
> Use this file to discover all available pages before exploring further.
# Topic Correlations & Correlation Explanation
> Understand how Caplena measures the strength of relationships between topics, and how to interpret the results.
The **Topic Correlations** view helps you discover which themes in your data tend to appear together, and the **Correlation Explanation** shows *why* they're connected.
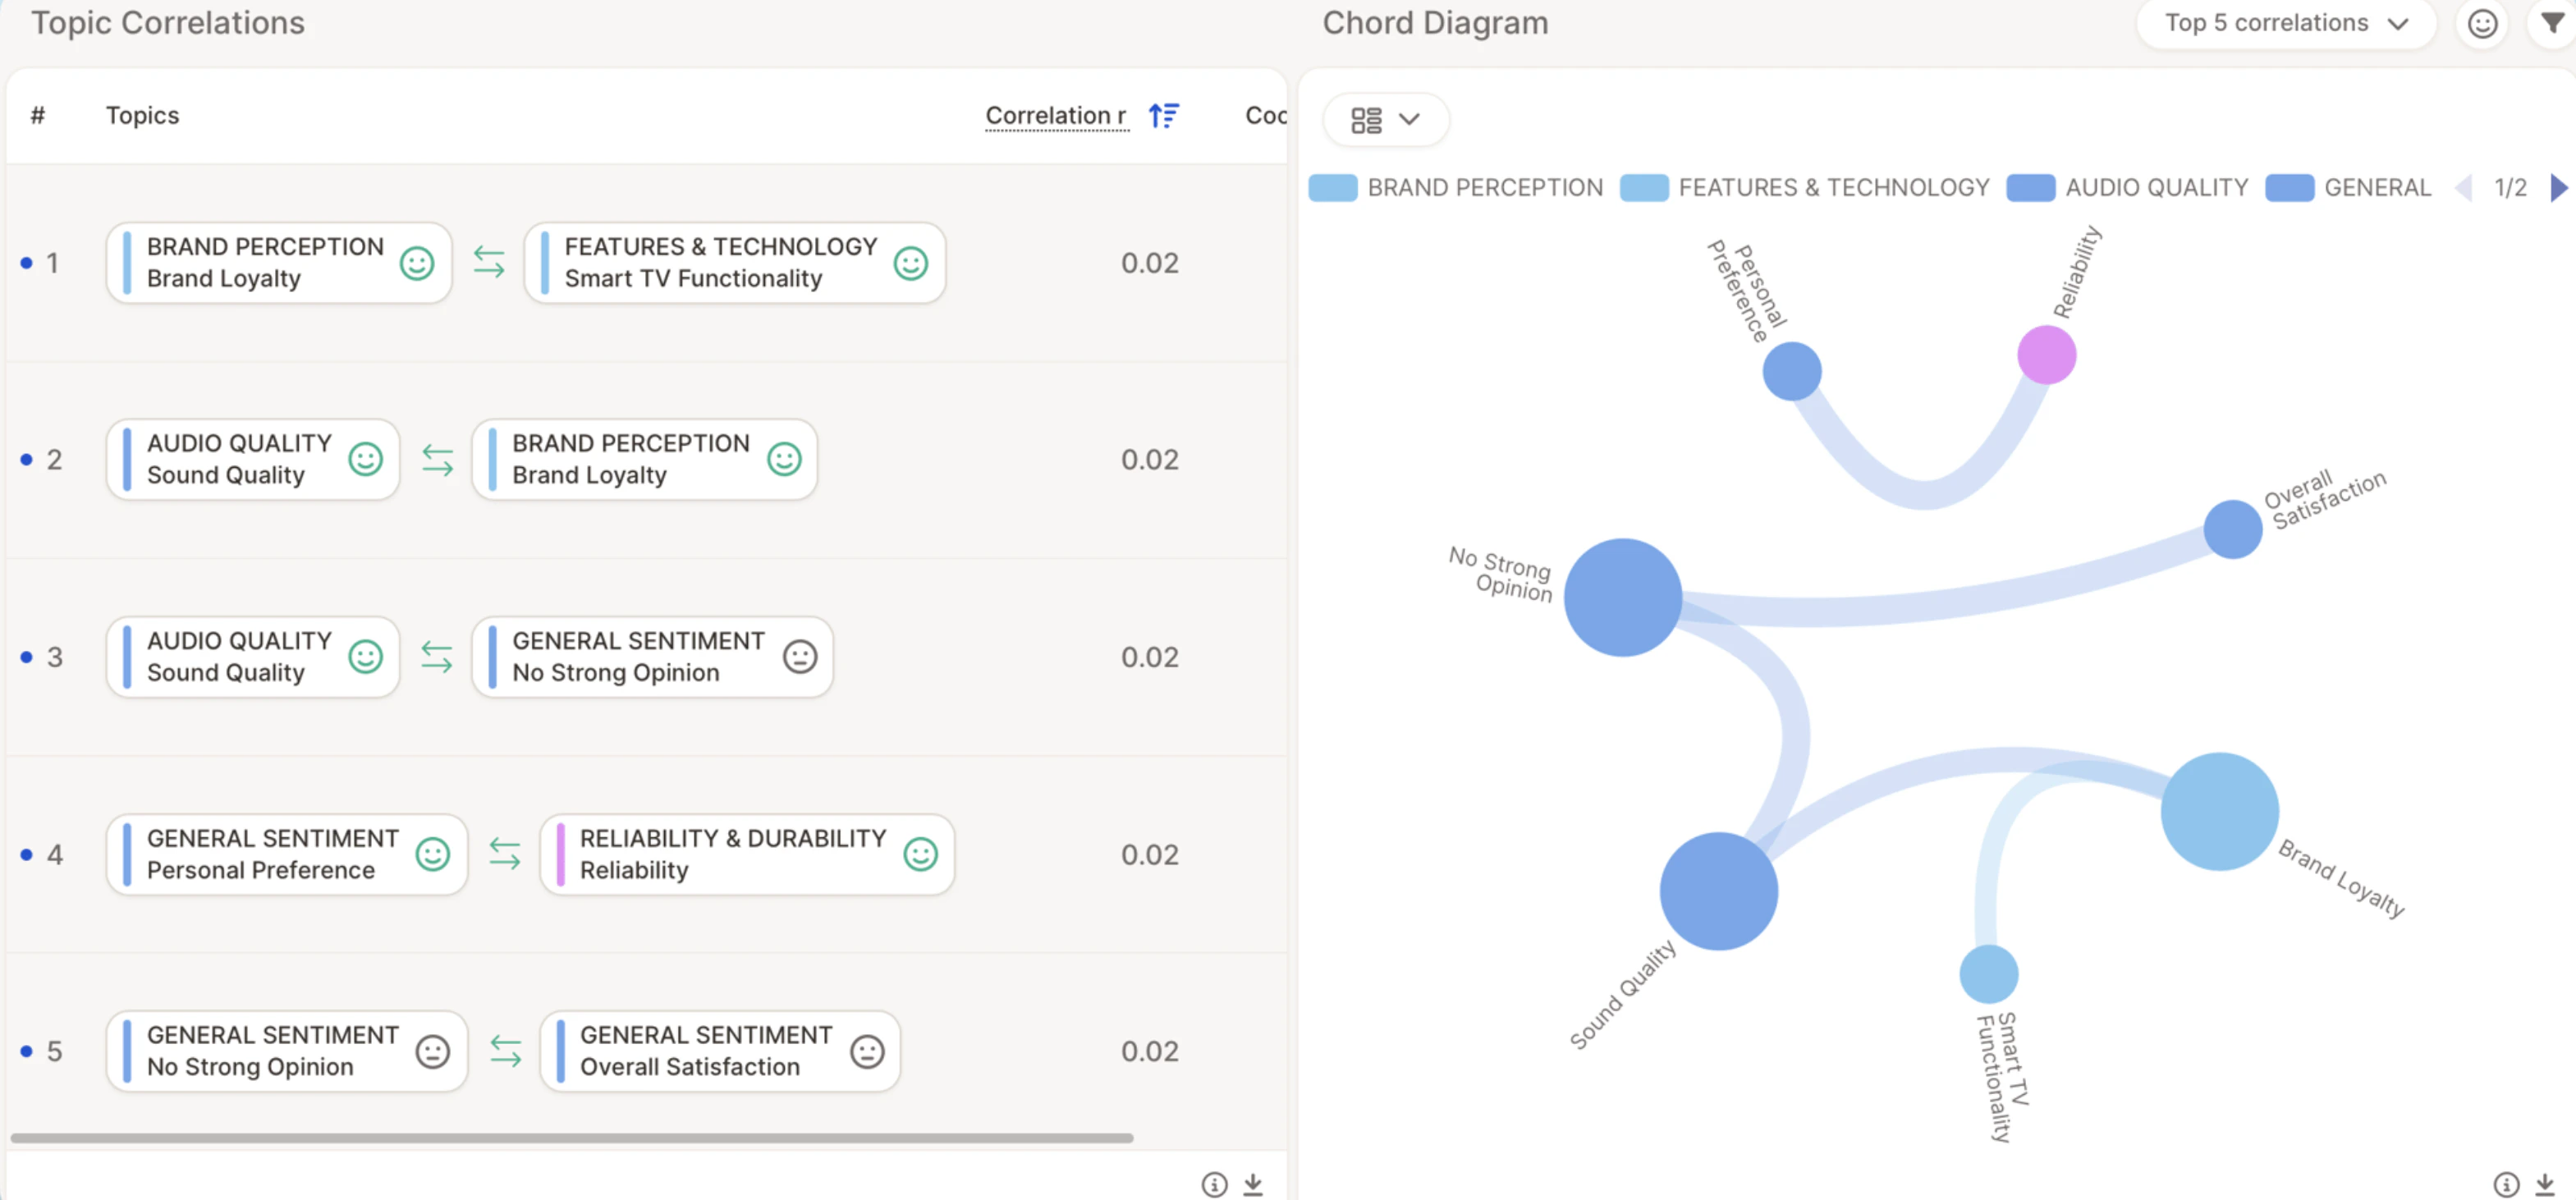 ## What It Shows
Caplena automatically detects relationships between topics that are frequently mentioned in the same responses. Each row in the table represents a **pair of correlated topics**, showing how strongly they are linked. The **correlation score (r)** tells you the strength of the relationship — higher values mean the topics co-occur more often.
**Example:** **Audio Quality ↔ Visual Quality (r = 0.53)** — respondents who mention sound quality also often talk about picture quality.
## Switch Between Views
On the right-hand side, you can explore your correlations in two different views:
### Chord Diagram
A visual map showing how your topics connect.
* Each **bubble** represents a topic.
* **Lines** show connections between topics — the thicker the line, the stronger the correlation.
* **Bubble size** reflects how frequently a topic appears in your dataset.
Hover over a topic to highlight its links, or click to explore specific relationships.
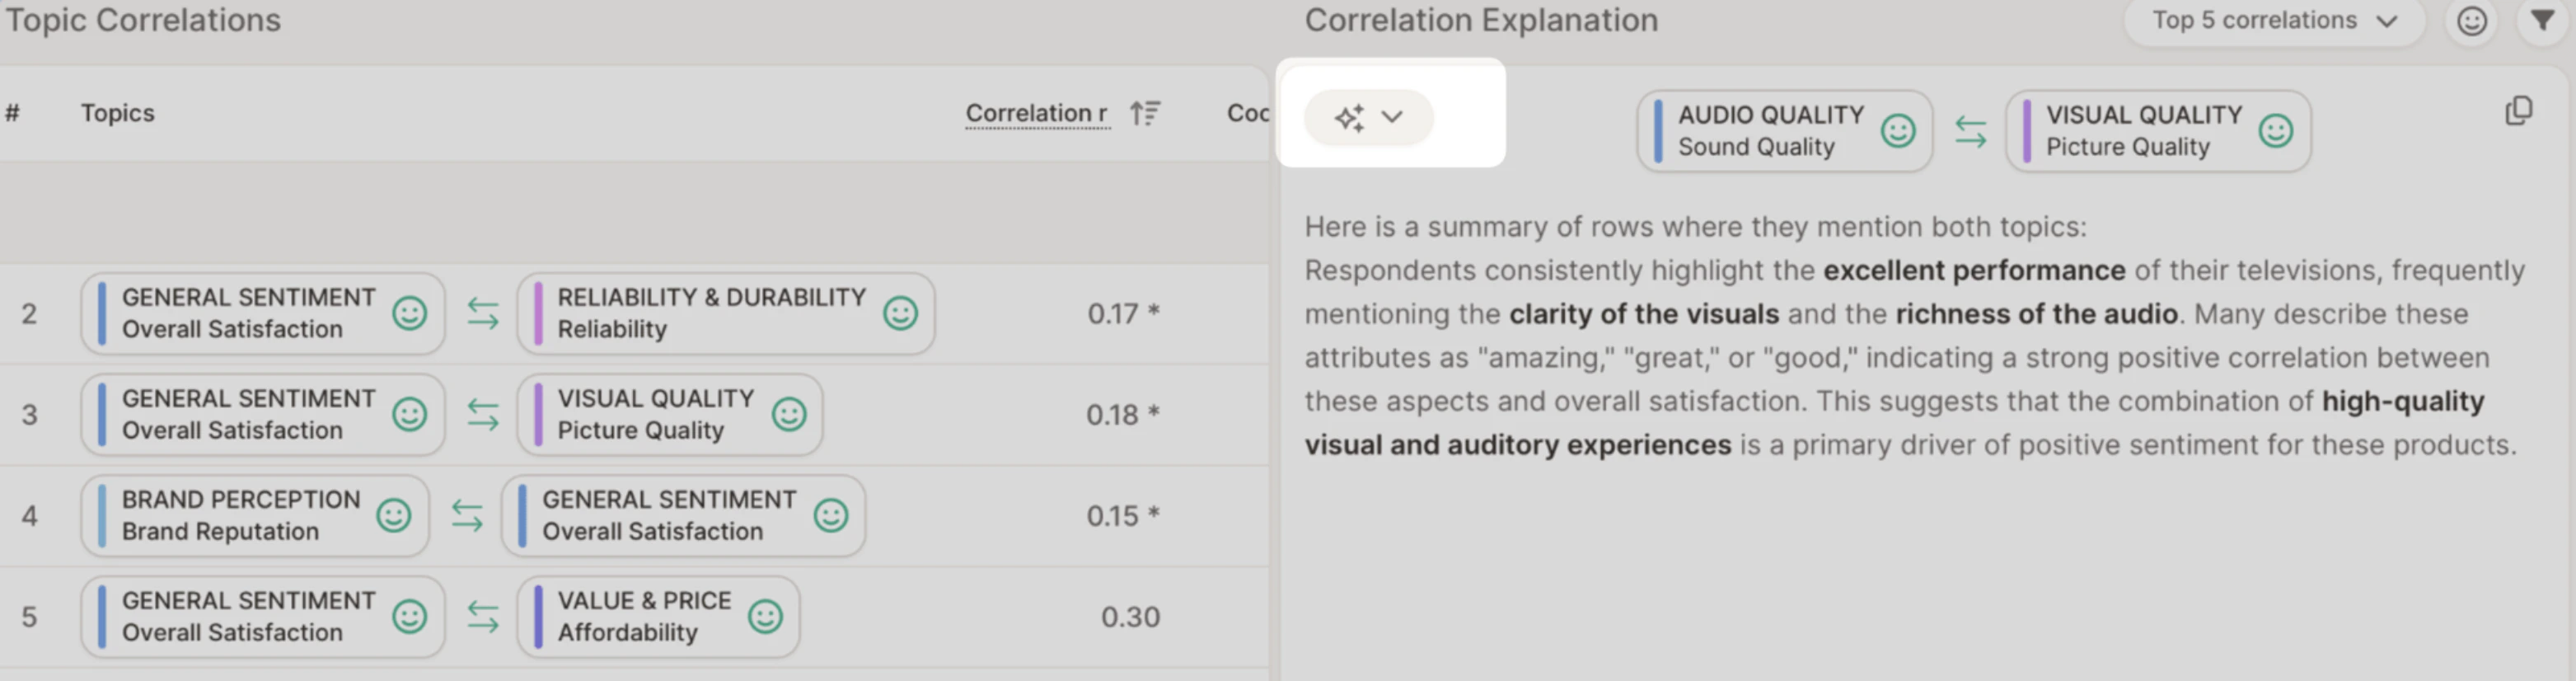
### Correlation Explanation
When you switch to this view, Caplena's AI provides a **written summary** explaining the connection between the selected topics.
## What It Shows
Caplena automatically detects relationships between topics that are frequently mentioned in the same responses. Each row in the table represents a **pair of correlated topics**, showing how strongly they are linked. The **correlation score (r)** tells you the strength of the relationship — higher values mean the topics co-occur more often.
**Example:** **Audio Quality ↔ Visual Quality (r = 0.53)** — respondents who mention sound quality also often talk about picture quality.
## Switch Between Views
On the right-hand side, you can explore your correlations in two different views:
### Chord Diagram
A visual map showing how your topics connect.
* Each **bubble** represents a topic.
* **Lines** show connections between topics — the thicker the line, the stronger the correlation.
* **Bubble size** reflects how frequently a topic appears in your dataset.
Hover over a topic to highlight its links, or click to explore specific relationships.
### Correlation Explanation
When you switch to this view, Caplena's AI provides a **written summary** explaining the connection between the selected topics.
 ## How the Correlation Metric Is Calculated
The correlation score is based on the **Kulczyński measure** (pronounced *Kool-chin-ski*). This score ranges from **0 to 1** and shows how likely two topics are to appear together.
* A value **close to 1** means the topics are strongly related.
* A value **close to 0** means they rarely appear together.
Unlike simpler methods, this measure accounts for how often each topic appears individually — so it works well even when one topic is far more common than the other.
### The Idea Behind It
> The Kulczyński score asks: "If I see Topic A, how often do I also see Topic B?" — and vice versa — then takes the average of both directions.
That's why it's great for spotting balanced, meaningful relationships rather than random overlaps.
**Formula:**
```text theme={null}
0.5 * (A / (A + B) + A / (A + C))
```
Where:
* **A** = number of responses mentioning *both* topics
* **B** = number of responses mentioning *only* Topic 1
* **C** = number of responses mentioning *only* Topic 2
**Example calculation:**
To calculate the Kulczyński value between Design and Product:
* Design and Product mentioned together: **A = 100**
* Design mentioned alone (without Product): **B = 20**
* Product mentioned alone (without Design): **C = 80**
```text theme={null}
0.5 * (100 / 120 + 100 / 180) = 0.7
```
### More Examples
| Topic A Mentions | Topic B Mentions | Both Together | Kulczyński | What It Means |
| :--------------- | :--------------- | :------------ | :--------- | :------------------------------------------------------------ |
| 100 | 100 | 50 | 0.50 | Appear together half the time — moderately related. |
| 100 | 1 | 1 | 0.505 | Topic B is rare, but always appears with A — noticeable link. |
| 50 | 100 | 50 | 0.75 | Every time A appears, it's with B — strong connection. |
## How the Correlation Metric Is Calculated
The correlation score is based on the **Kulczyński measure** (pronounced *Kool-chin-ski*). This score ranges from **0 to 1** and shows how likely two topics are to appear together.
* A value **close to 1** means the topics are strongly related.
* A value **close to 0** means they rarely appear together.
Unlike simpler methods, this measure accounts for how often each topic appears individually — so it works well even when one topic is far more common than the other.
### The Idea Behind It
> The Kulczyński score asks: "If I see Topic A, how often do I also see Topic B?" — and vice versa — then takes the average of both directions.
That's why it's great for spotting balanced, meaningful relationships rather than random overlaps.
**Formula:**
```text theme={null}
0.5 * (A / (A + B) + A / (A + C))
```
Where:
* **A** = number of responses mentioning *both* topics
* **B** = number of responses mentioning *only* Topic 1
* **C** = number of responses mentioning *only* Topic 2
**Example calculation:**
To calculate the Kulczyński value between Design and Product:
* Design and Product mentioned together: **A = 100**
* Design mentioned alone (without Product): **B = 20**
* Product mentioned alone (without Design): **C = 80**
```text theme={null}
0.5 * (100 / 120 + 100 / 180) = 0.7
```
### More Examples
| Topic A Mentions | Topic B Mentions | Both Together | Kulczyński | What It Means |
| :--------------- | :--------------- | :------------ | :--------- | :------------------------------------------------------------ |
| 100 | 100 | 50 | 0.50 | Appear together half the time — moderately related. |
| 100 | 1 | 1 | 0.505 | Topic B is rare, but always appears with A — noticeable link. |
| 50 | 100 | 50 | 0.75 | Every time A appears, it's with B — strong connection. |