How Is the Net Sentiment Score Calculated?
The formula is simple:Net Sentiment Score = % Positive – % NegativeThis results in a score ranging from:
- +100 → all responses are positive
- 0 → equal balance between positive and negative
- –100 → all responses are negative
🔴 A lower score suggests a predominance of negative sentiment
- 84.5% of comments are classified as positive
- 13.2% are negative
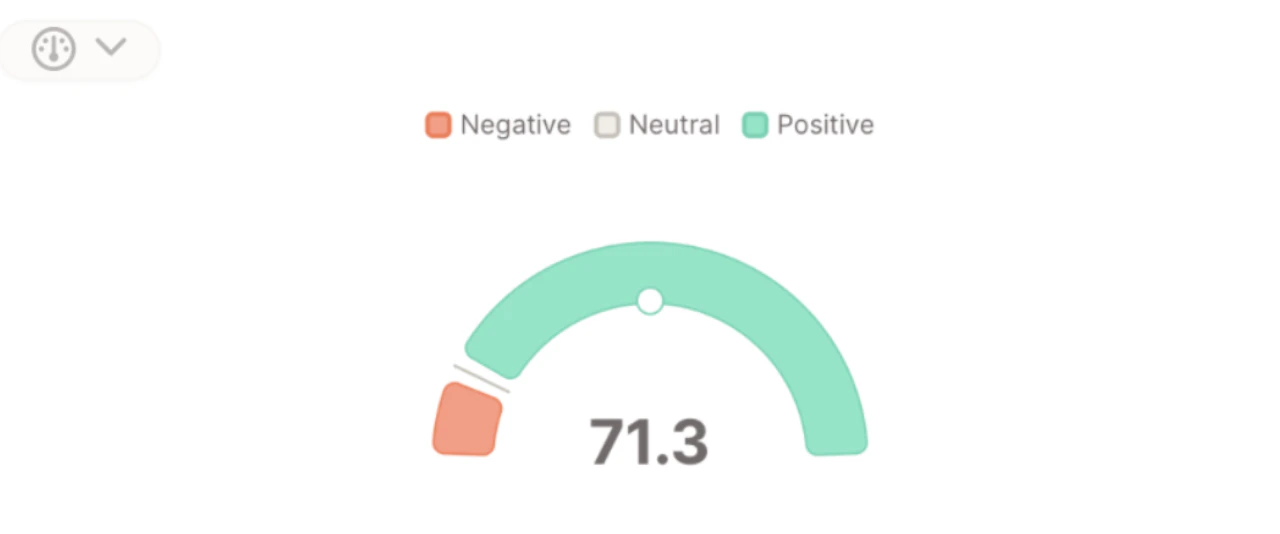
84.5 – 13.2 = 71.3
Visualizing Net Sentiment
There are two ways to visualize Net Sentiment in Caplena using Insight Elements:1. Net Sentiment (Gauge + Summaries)
- A gauge displaying the current score
- An AI-generated Positive Sentiment Summary
- An AI-generated Negative Sentiment Summary
Best for one-time reports, dashboard overviews, and highlighting what customers like or dislike.
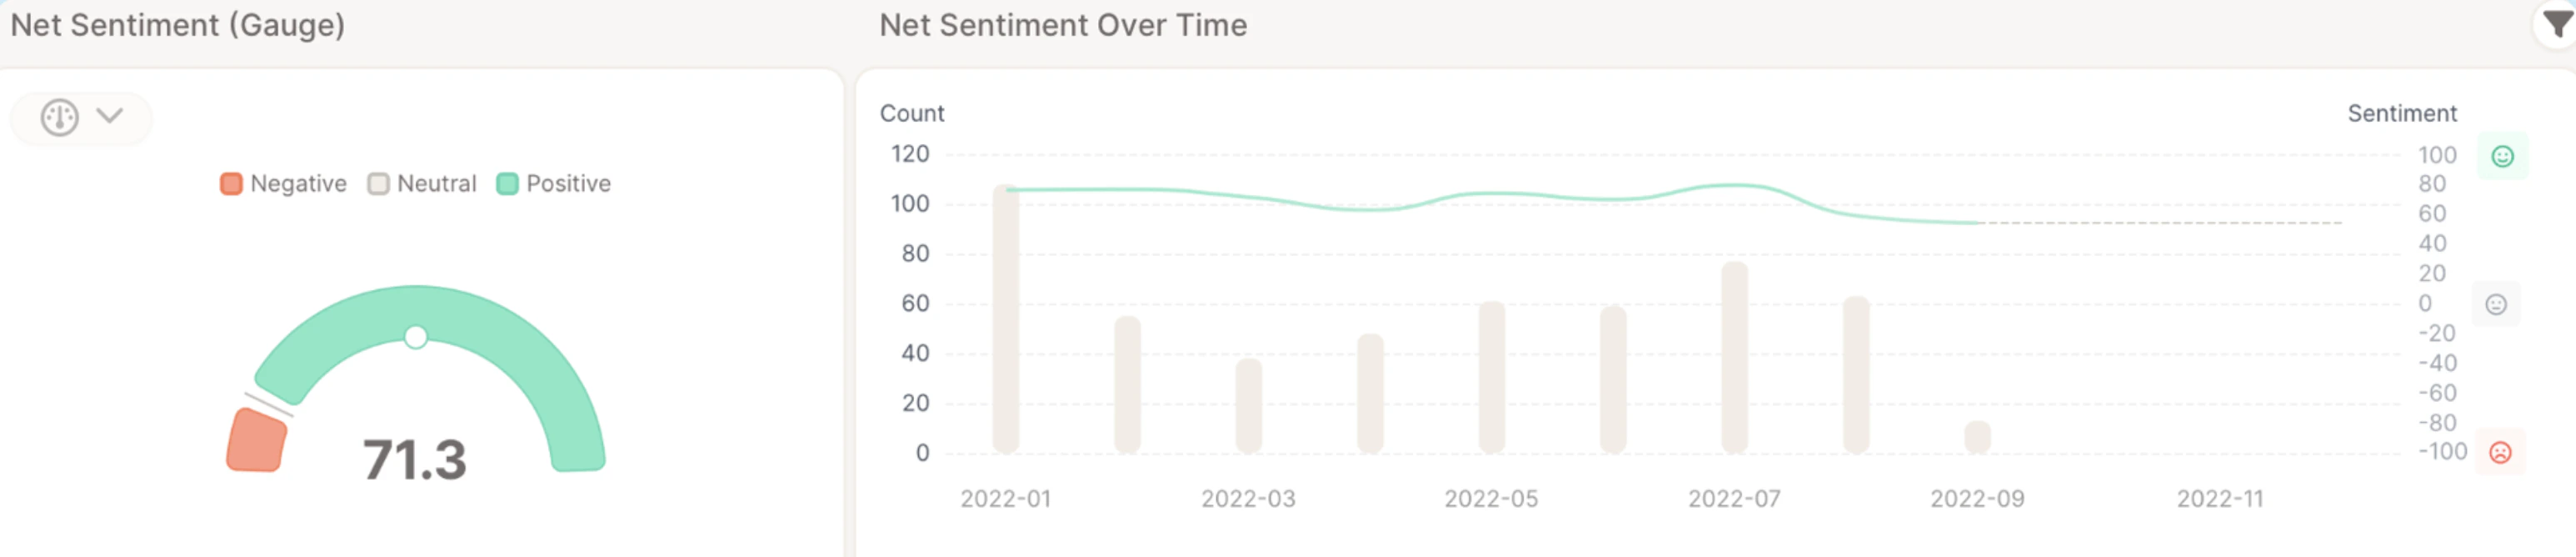
2. Net Sentiment Over Time
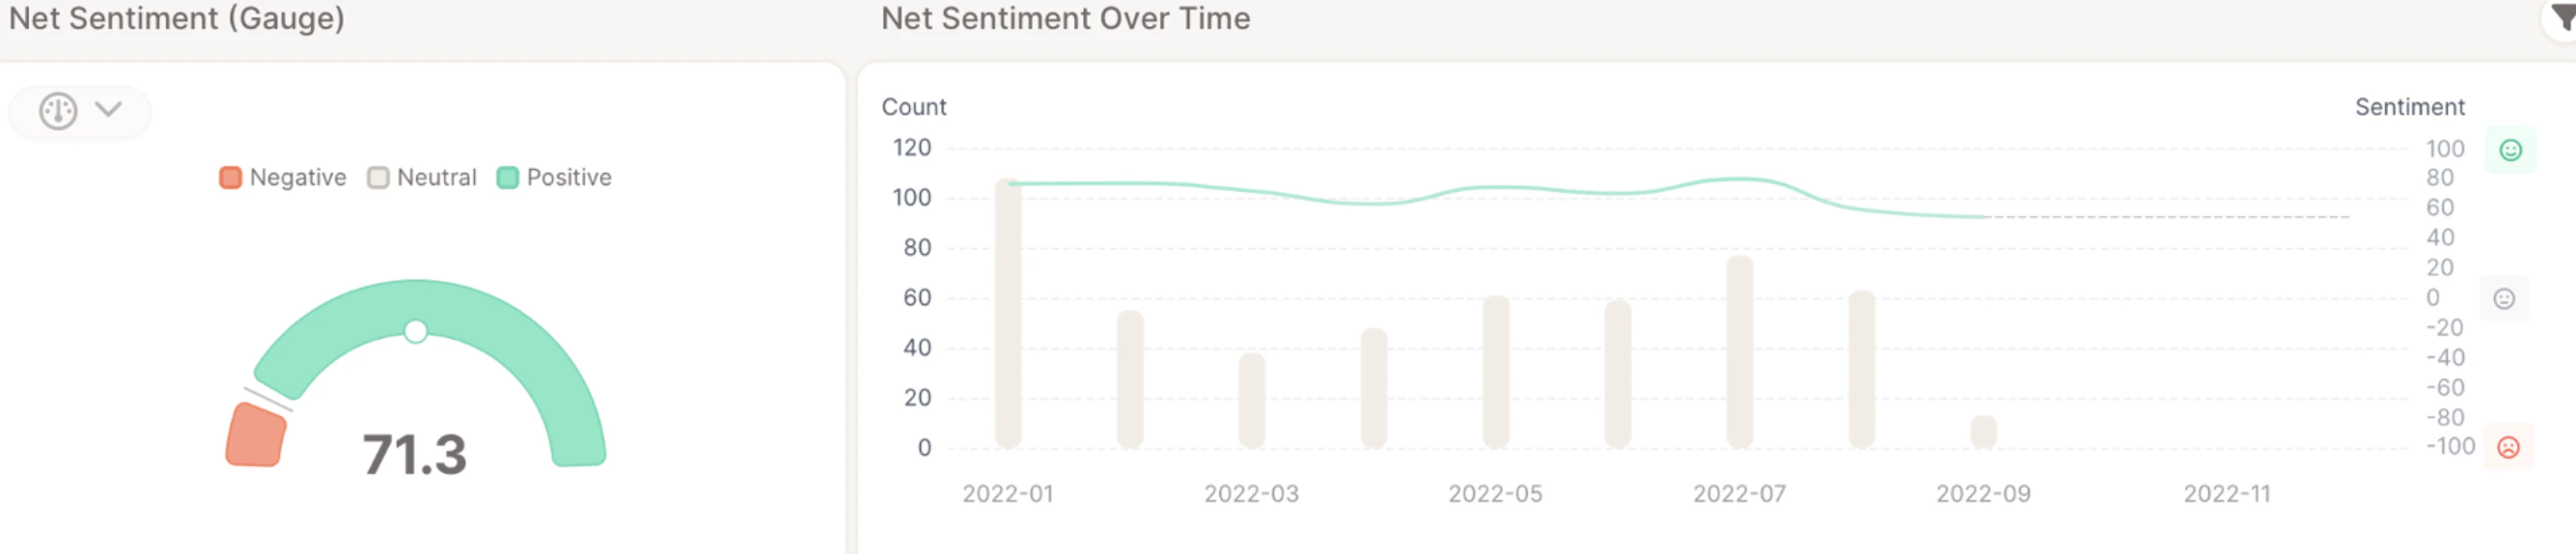
- A gauge displaying the current score
- A line chart showing how sentiment changes over time
Best for tracking sentiment development over time or identifying turning points in customer perception.
Use Cases
Use the Net Sentiment Score to:- Benchmark overall customer sentiment
- Track emotional tone over time (with date variable)
- Supplement or replace metrics like NPS or CSAT