- Recode values into cleaner categories
- Apply formulas to transform data
- Extract new attributes like emotions or brand mentions
Mappings
Formulas
LLMs
Quick start
Regardless of the mode you choose, creating your first Smart Column is easy:- Pick your source column → the data you want to transform (e.g.
Language,Text to analyze, orCountry). - Choose a mode → Mapping, Formula, or LLM, depending on your goal.
- Configure the transformation → add logic, mappings, prompts, or formulas.
Drafts and live columns
Every Smart Column starts as a draft. A draft lets you experiment freely — preview results, iterate on the configuration, and tweak prompts or mappings — without using up a Smart Column slot from your plan. Drafts don’t compute values for your full dataset and don’t appear alongside your live columns in analyses.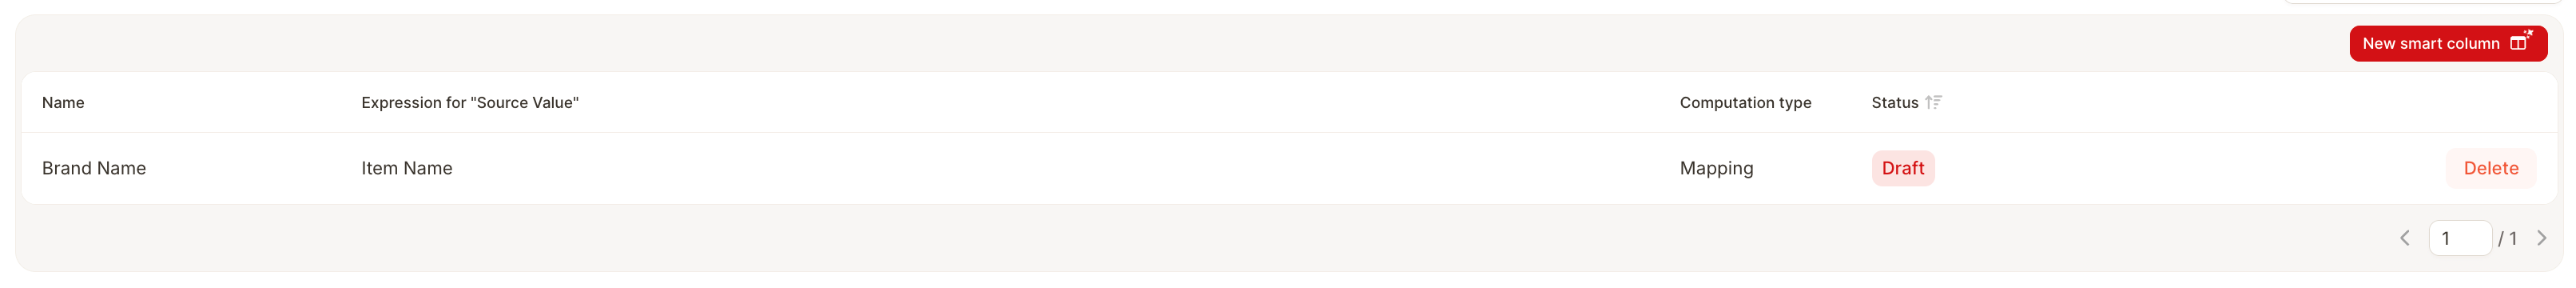
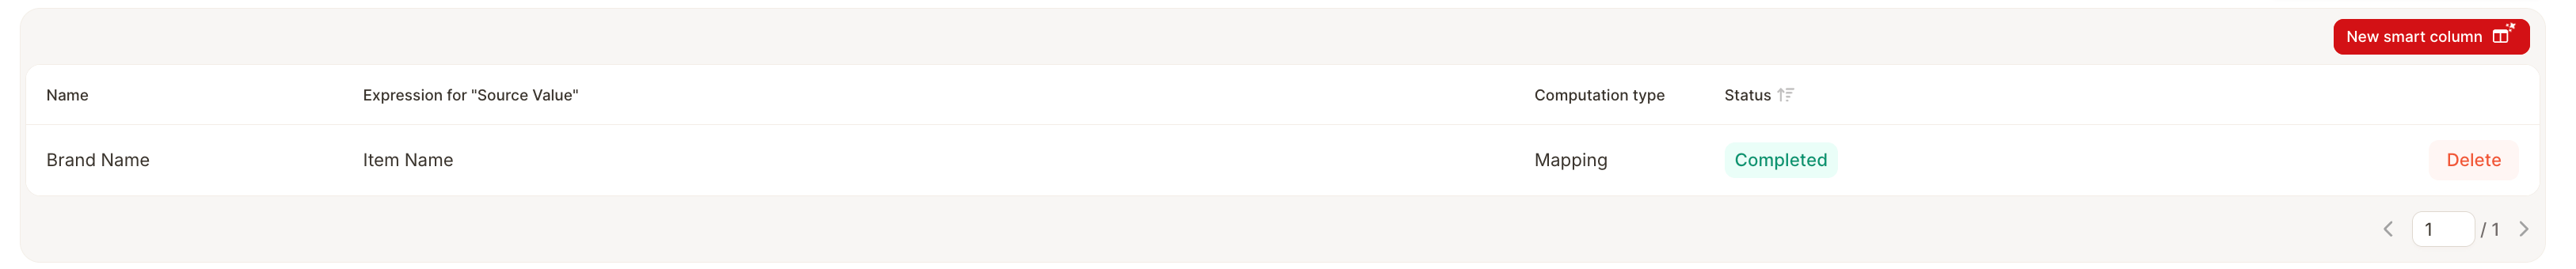
Once a Smart Column is live, it cannot be reverted back to a draft. You can still edit a live column’s configuration — just keep in mind the change applies immediately. If you no longer need a live column, delete it instead.
How to select your source column
Before anything can be transformed, you need to tell Caplena which column to use.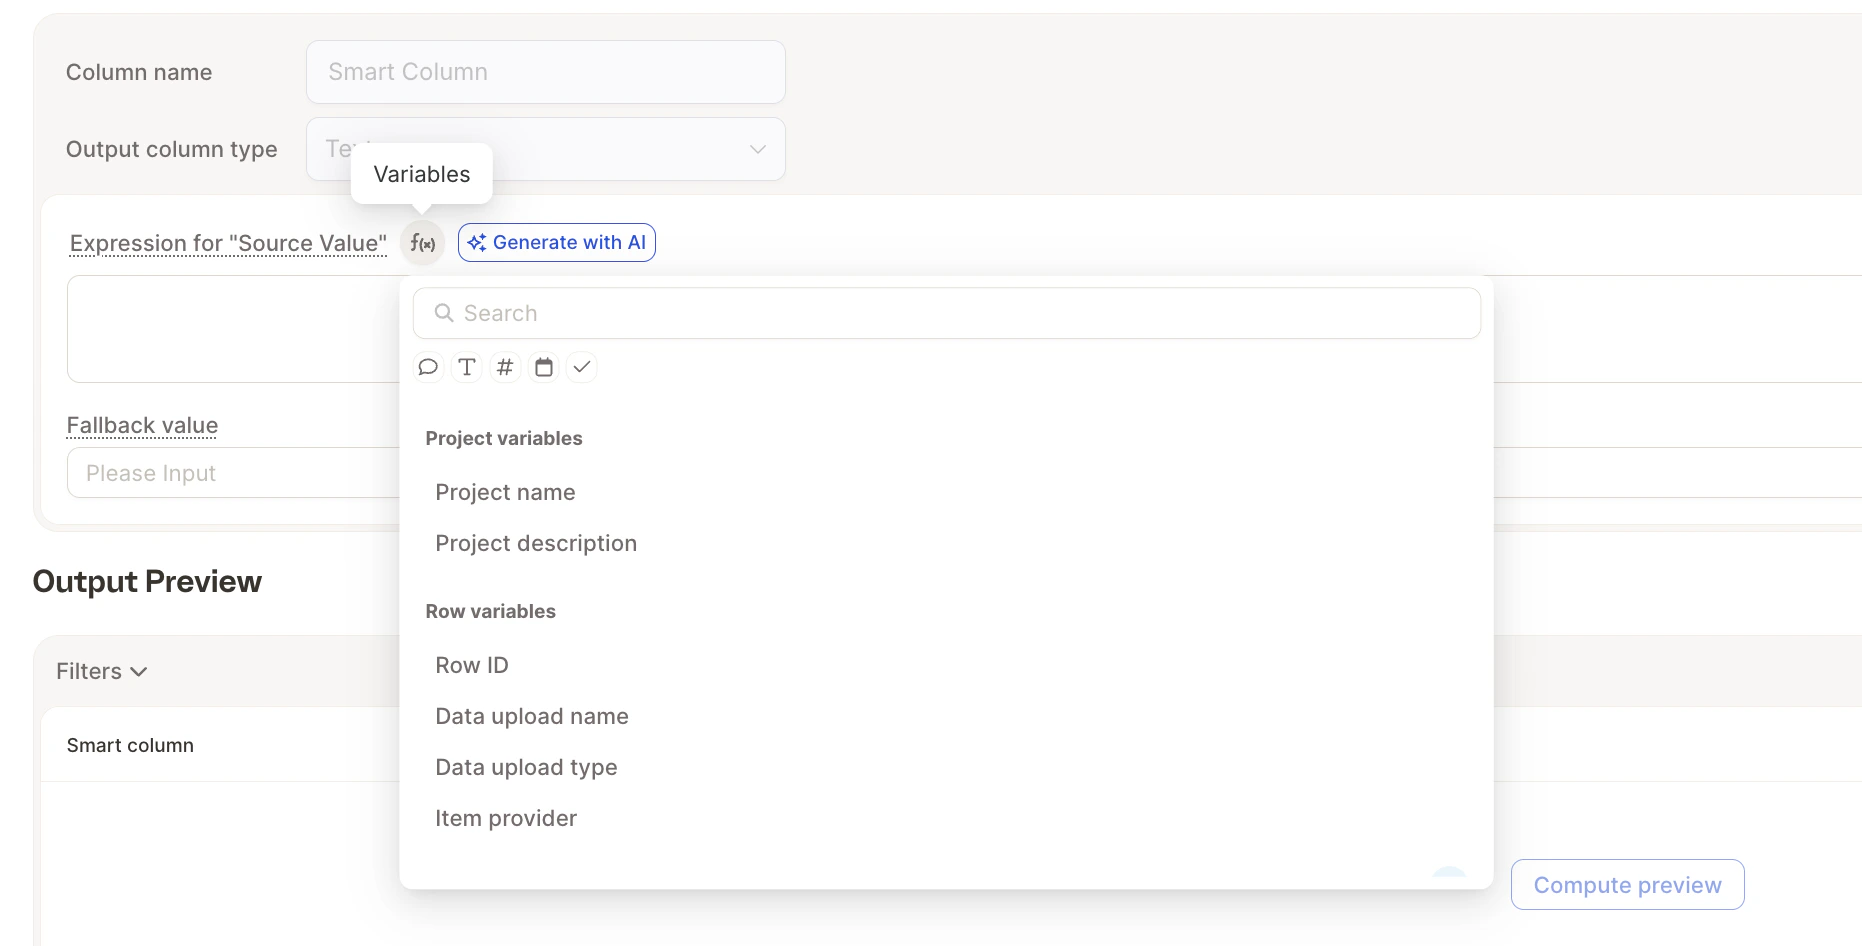
1. Mapping mode
Got inconsistent values that need standardizing? Mapping mode is your best friend. You define a source value and map it to a desired output.Example
- LV → Latvian
- ❓ Anything else → becomes your fallback value (e.g., “Other”)
2. Formula mode
Want to reverse a string, calculate something, or clean up a date? Use Formula mode, powered by Jinja syntax.Not a coding wizard? No problem! Ask ChatGPT to write formulas for you.
Example: Reverse a String
To reverse the content of a column (e.g.,Text to analyze), use:
This formula:
- Converts the string into a list of characters
- Reverses that list
- Joins it back into a string
Caplena is awesome → emosewa si anelpaC
Jinja Flavor & Sandbox
Formula mode runs on Jinja2 using a sandboxed environment (SandboxedEnvironment). This means all standard Jinja2 features are available — conditionals, loops, filters, string/number/date manipulation — while unsafe operations (arbitrary Python execution, file access, etc.) are blocked for security. A few things to keep in mind:
- Variables that are missing for a row (e.g. a column has no value for that row) are treated as falsy in
{% if %}checks and as not-equal in comparisons, rather than raising an error. - Output is always coerced to a string before being parsed into the column’s target type (Text, Number, Boolean, Date).
- Empty string output is treated the same as no value — the cell will be left blank.
Custom Filters
On top of standard Jinja2 filters, Caplena provides the following built-in custom filters:address_to_coordinates
Geocodes a free-text address or place name to its [longitude, latitude] coordinates using the Mapbox API. Usage:
[longitude, latitude] as floats, e.g. [8.5417, 47.3769]. To extract individual components, use Jinja’s index access:
3. LLM mode
This mode applies AI models (LLMs) to process free-text inputs, enabling more advanced use cases like summarization or classification. Common use cases:- Extracting brand names
- Detecting emotion or sentiment
- Removing slurs or sensitive content
- Creating summaries
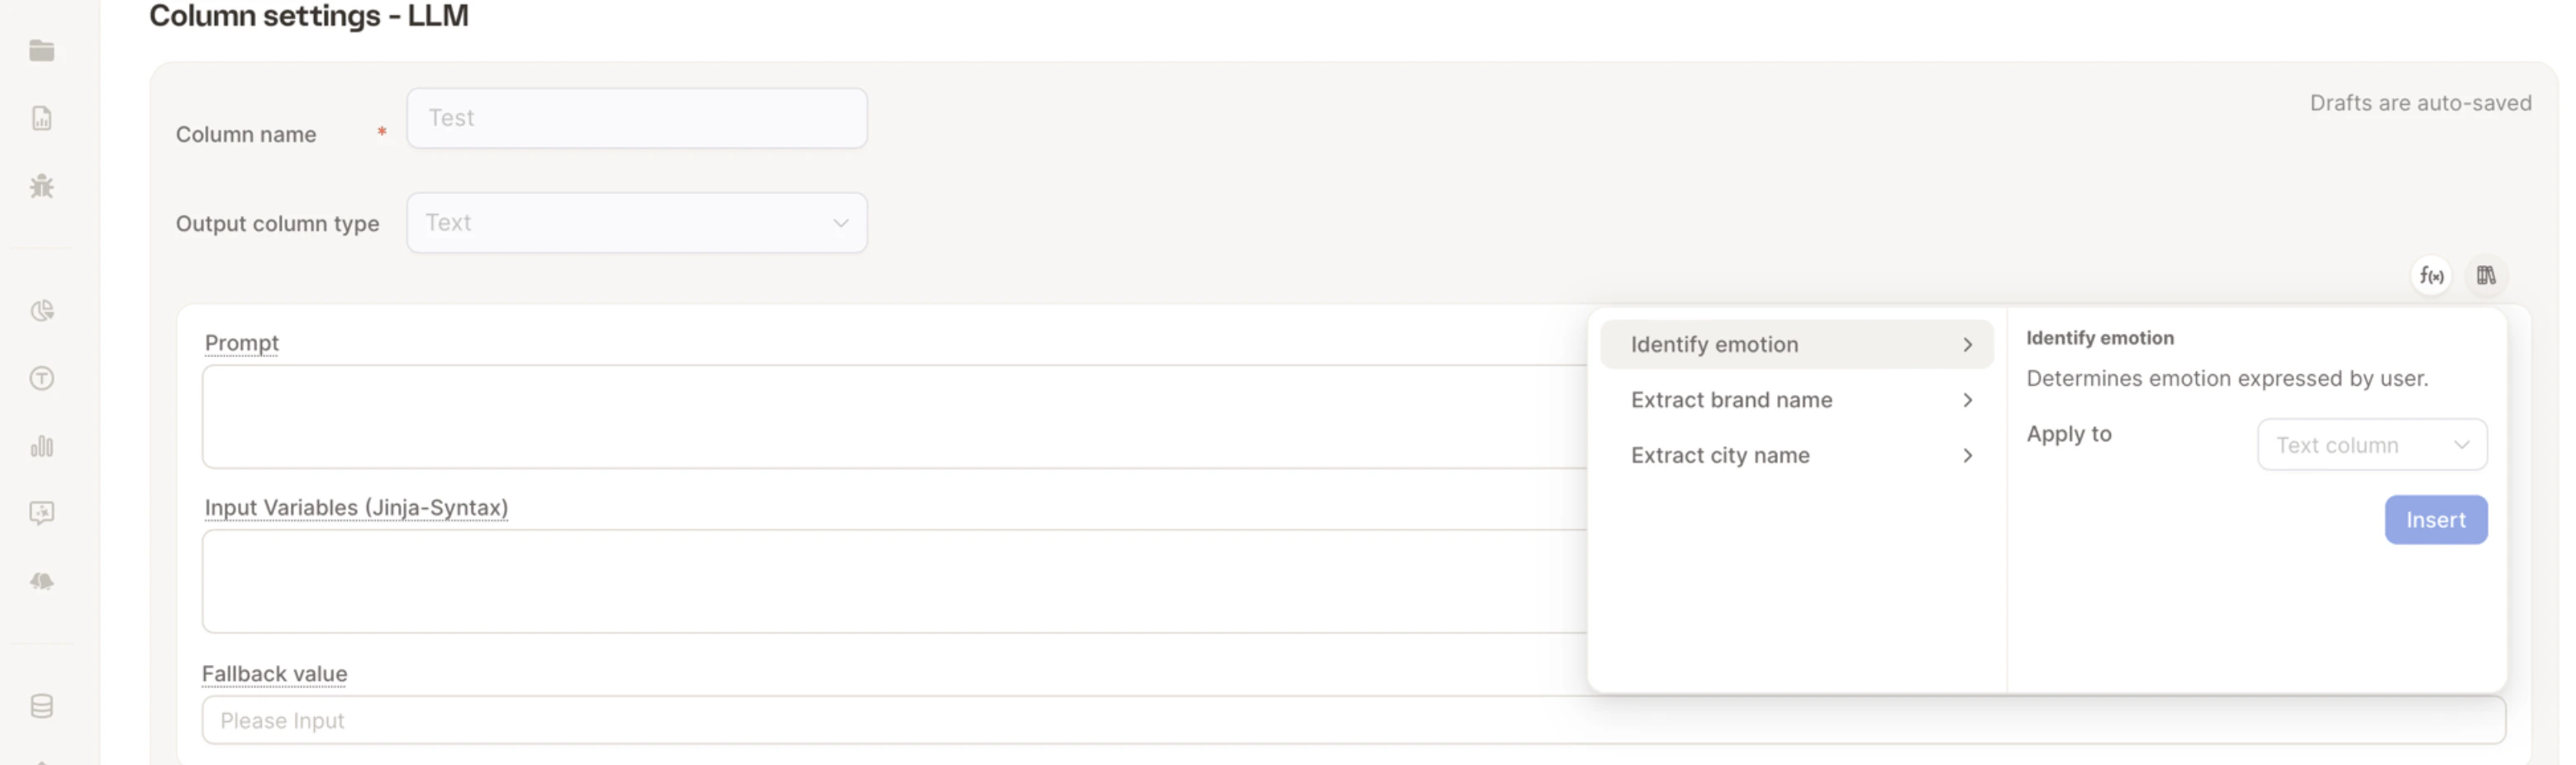
Templates Available
Caplena provides a growing template library with ready-to-use prompts for common use cases. These templates help you:- Get started quickly
- Ensure consistent and high-quality results
- Customize further if needed
Config history
Every time you change a Smart Column’s configuration, Caplena keeps the previous version. Config history lets you browse those past versions, compare them with your current setup, and roll back if needed.Where to Find It
Open a Smart Column’s detail page. A Config history button appears in the header once the column has at least one earlier version — for a brand-new column with no changes yet, the button stays hidden.Compare Versions
Config history shows a timeline that runs from when the column was created through to the Current version. Use the Compare with selector (or the timeline) to pick any earlier version, then read the two panels side by side: the selected historical configuration on the left and your current configuration on the right. This works for all three modes — Mapping, Formula, and LLM — so you can see exactly what changed (timestamps are shown in your local timezone).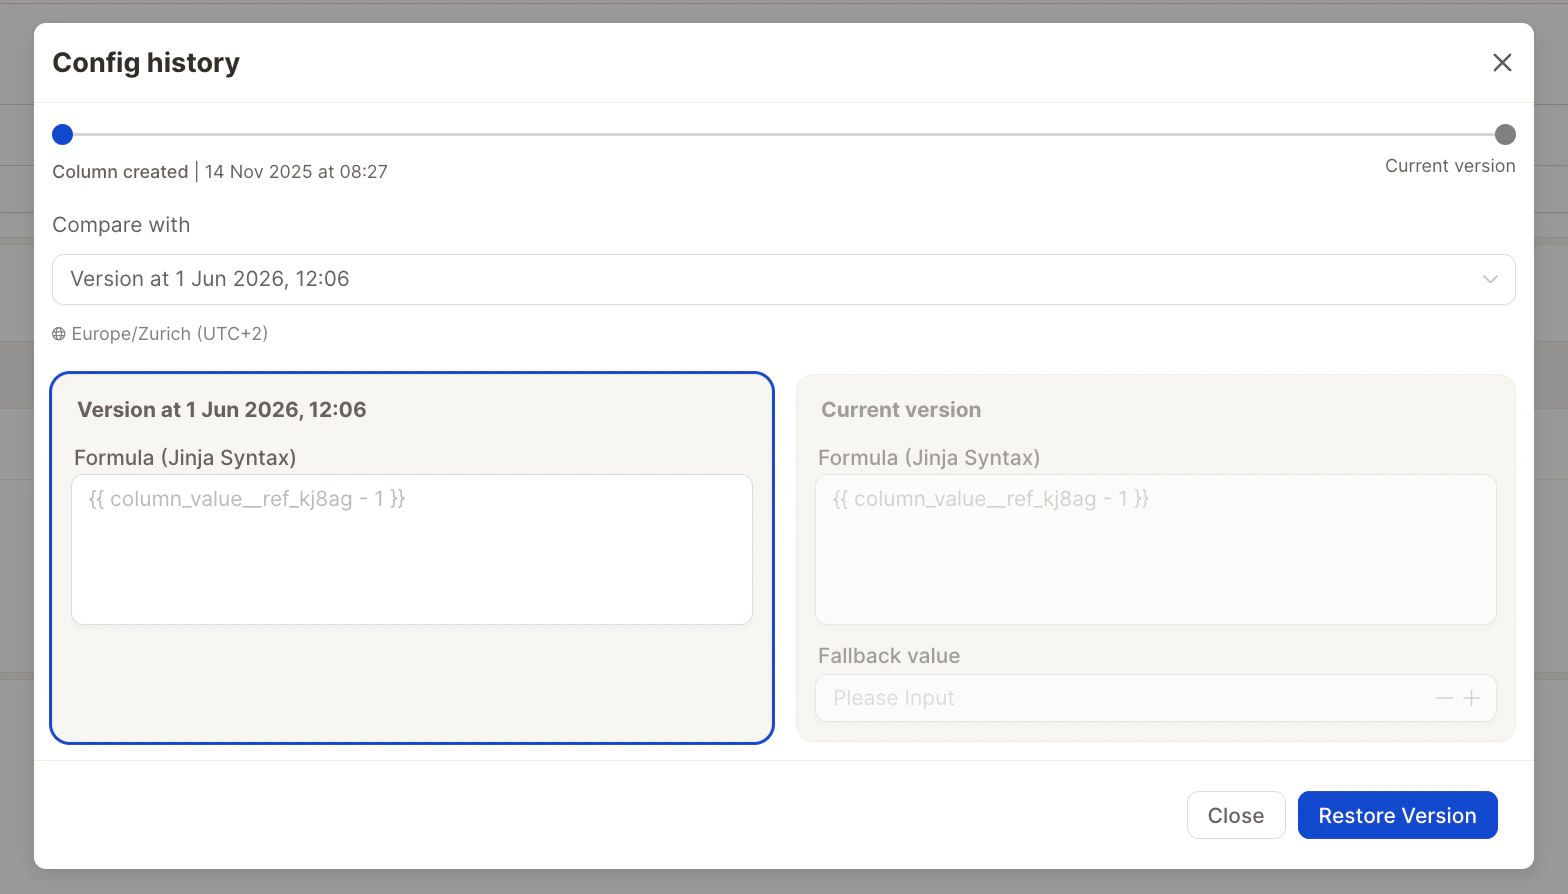
Restore a Version
To roll back, select the version you want and click Restore Version. Caplena applies that historical configuration and recomputes the column for new rows.Restoring is disabled while the column is still computing. Wait for the current run to finish before rolling back.
Delete a smart column
When you no longer need a smart column, you can delete it from the Smart Columns tab (row actions) or from the column’s detail modal. Caplena gives you two options in the confirmation dialog: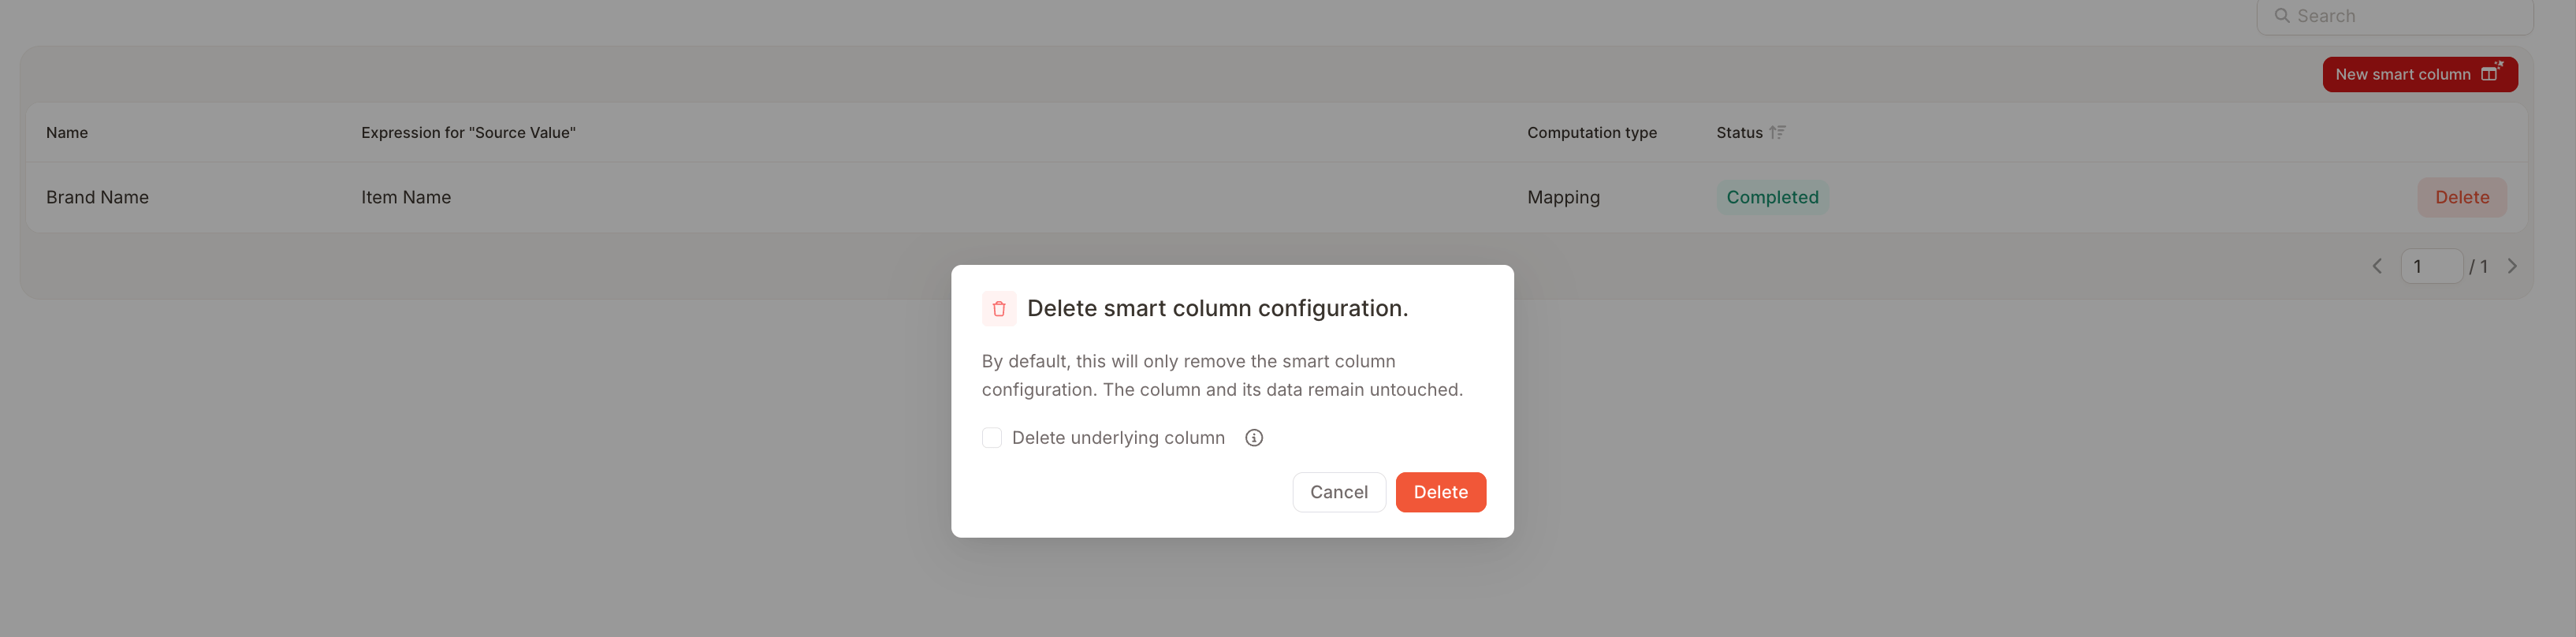
- Delete the smart column only (default): removes the smart column configuration but keeps the resulting column and its values in your dataset. The column becomes a regular, static column on the Data tab. Use this when you want to “freeze” the computed values — for example, after using a smart column to generate a row ID.
- Delete the underlying column too: removes both the configuration and the resulting column, including all of its values. Use this when the column is no longer needed anywhere in the project.
Deleting the underlying column
Tick Delete underlying column in the confirmation dialog to also remove the column itself. Because this affects more than just the smart column configuration, Caplena runs a few extra checks:Impact preview. Caplena lists any reports, alerts, or other computed columns that depend on the column. If a report or alert blocks deletion, you’ll see a warning and the Delete button stays disabled until you resolve the dependency.
Typed confirmation. Type
Delete into the confirmation field to enable the Delete button. This guard prevents accidental removal of data that is referenced elsewhere.Best practices
- Start small: Test your logic on a small dataset or with a few rows using the preview.
- Use templates: Especially for LLM tasks, templates can save time and provide a solid base.
- Use fallback values: Always define a fallback in mappings to handle unexpected inputs.
- Name your columns clearly: This helps when chaining multiple Smart Columns together.
- Chain columns: You can use the output of one Smart Column as the input for another (e.g., extract brand → map to numeric code).
- Keep prompts concise: For LLMs, simpler prompts tend to yield more consistent results.