What It Shows
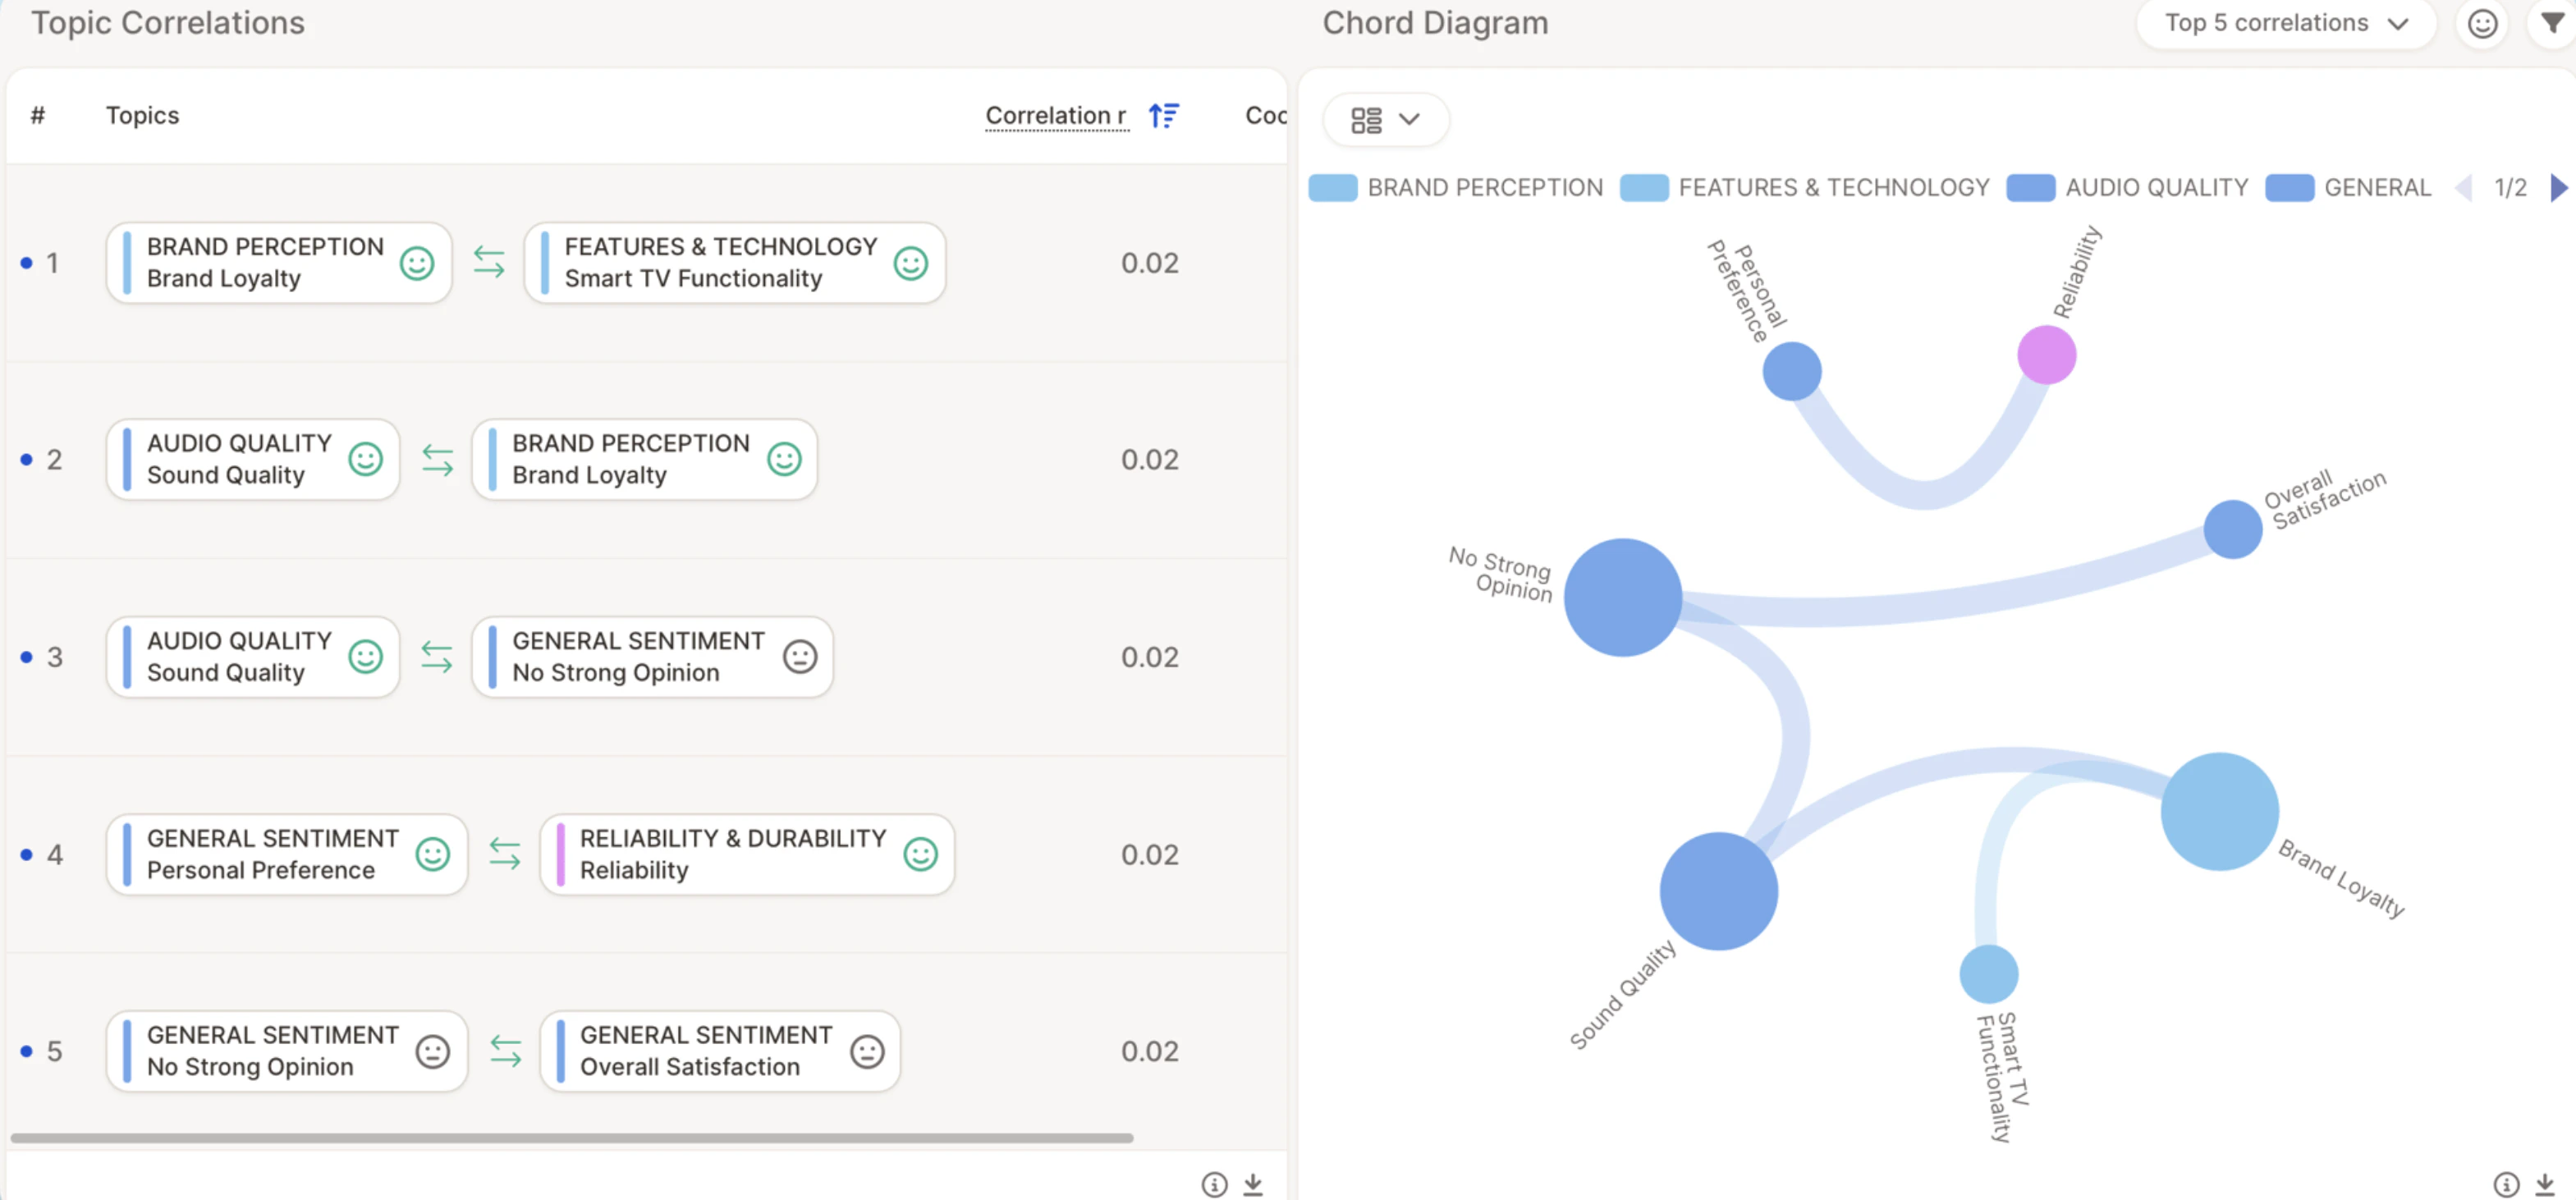
Caplena automatically detects relationships between topics that are frequently mentioned in the same responses. Each row in the table represents a pair of correlated topics, showing how strongly they are linked. The correlation score (r) tells you the strength of the relationship — higher values mean the topics co-occur more often.Example: Audio Quality ↔ Visual Quality (r = 0.53) — respondents who mention sound quality also often talk about picture quality.
Switch Between Views
On the right-hand side, you can explore your correlations in two different views:Chord Diagram
A visual map showing how your topics connect.- Each bubble represents a topic.
- Lines show connections between topics — the thicker the line, the stronger the correlation.
- Bubble size reflects how frequently a topic appears in your dataset.
Correlation Explanation
When you switch to this view, Caplena’s AI provides a written summary explaining the connection between the selected topics.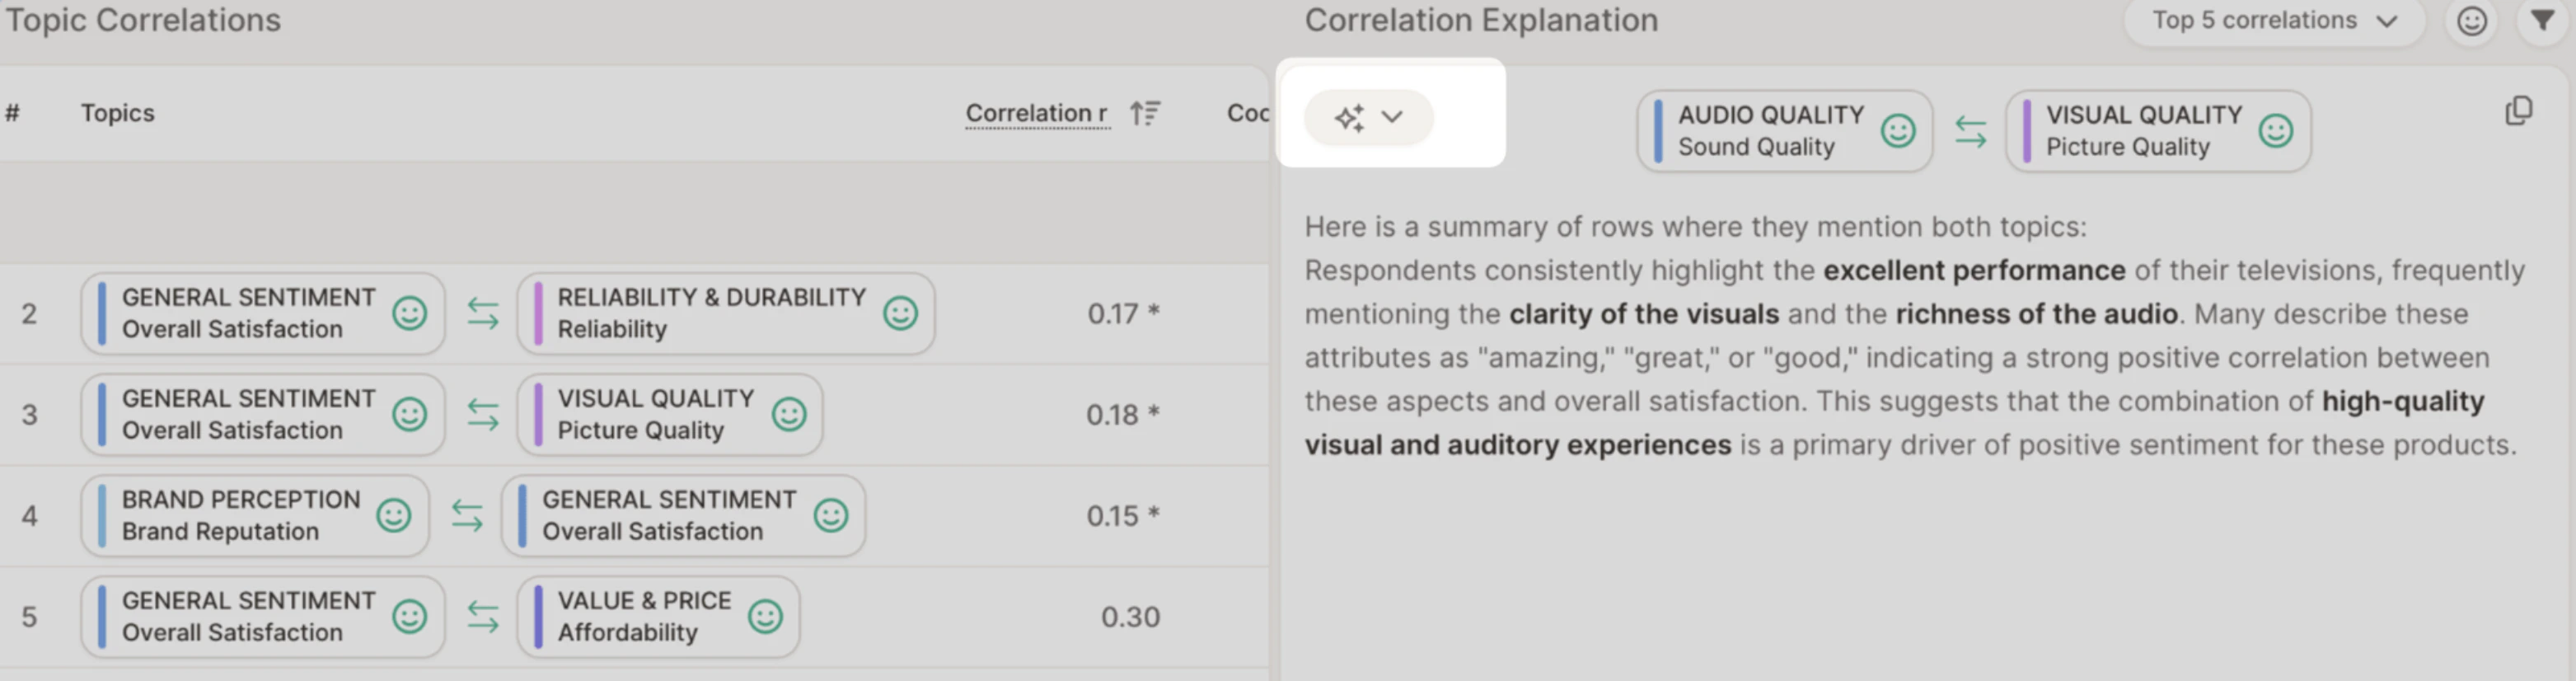
How the Correlation Metric Is Calculated
The correlation score is based on the Kulczyński measure (pronounced Kool-chin-ski). This score ranges from 0 to 1 and shows how likely two topics are to appear together.- A value close to 1 means the topics are strongly related.
- A value close to 0 means they rarely appear together.
The Idea Behind It
The Kulczyński score asks: “If I see Topic A, how often do I also see Topic B?” — and vice versa — then takes the average of both directions.That’s why it’s great for spotting balanced, meaningful relationships rather than random overlaps. Formula:
- A = number of responses mentioning both topics
- B = number of responses mentioning only Topic 1
- C = number of responses mentioning only Topic 2
- Design and Product mentioned together: A = 100
- Design mentioned alone (without Product): B = 20
- Product mentioned alone (without Design): C = 80