

The Core Concept: How Reports Are Structured
Every report in Caplena has two layers:
- Report Master – where you build the structure
- Views – different perspectives on top of that structure
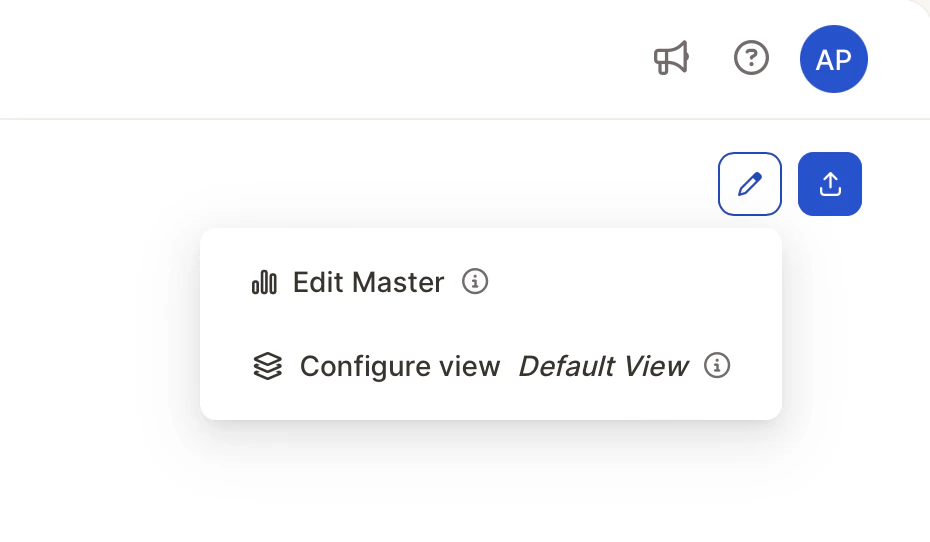
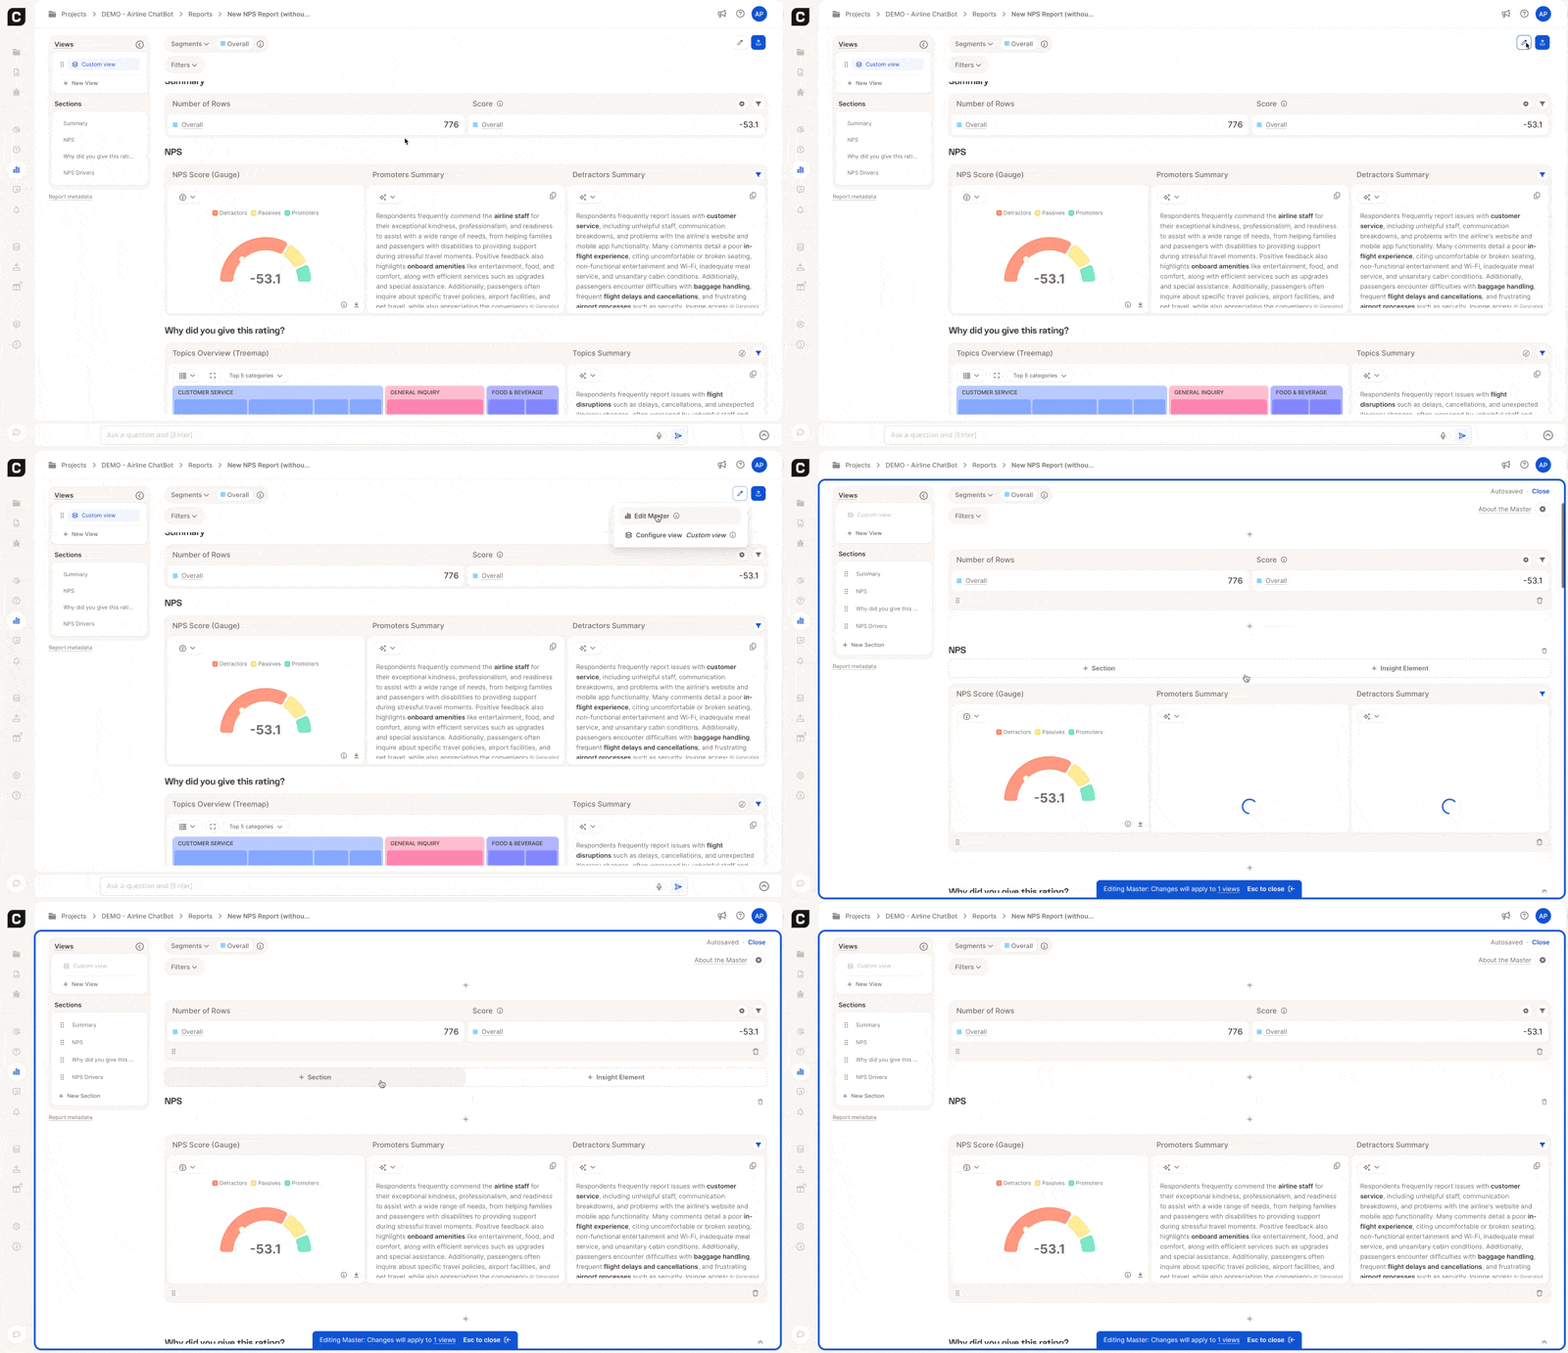
Report Master: Where You Build the Report
The Report Master is the blueprint of your report. This is where you build and edit the actual content of your report — what appears, how it’s structured, and how the story flows. In the Master, you can:- Add / remove / rename Sections
- Add and arrange Insight Elements
- Reorder anything via drag-and-drop
- Adjust layout and structure
- Build Segments
Views: Tailored Perspectives for Your Audience
Views sit on top of the Report Master. A view can apply or lock filters, show specific segments, and be shared on its own, so you can tailor the same report for different stakeholders, teams, or regions without changing its structure.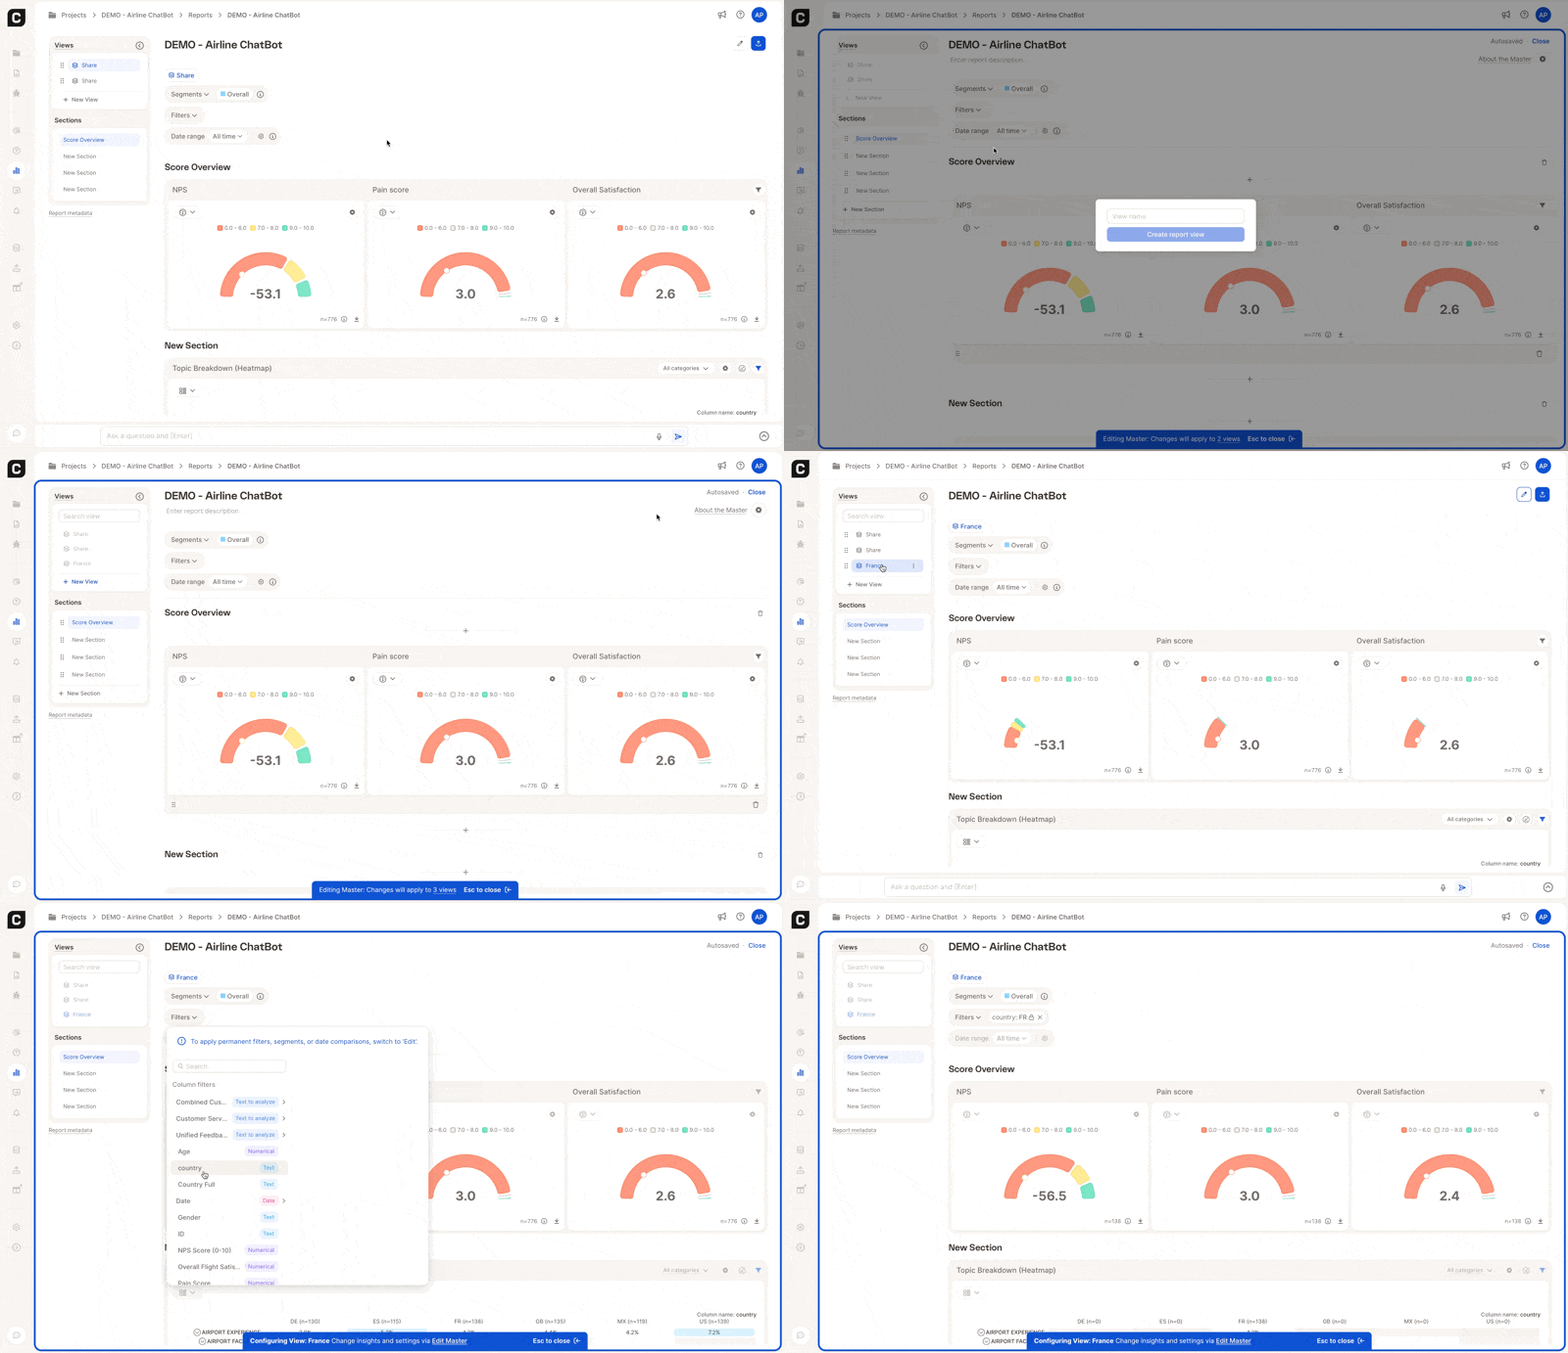
Sections: Organize Your Report
Sections help you break down complex data into manageable chunks, making your report easier to read and understand.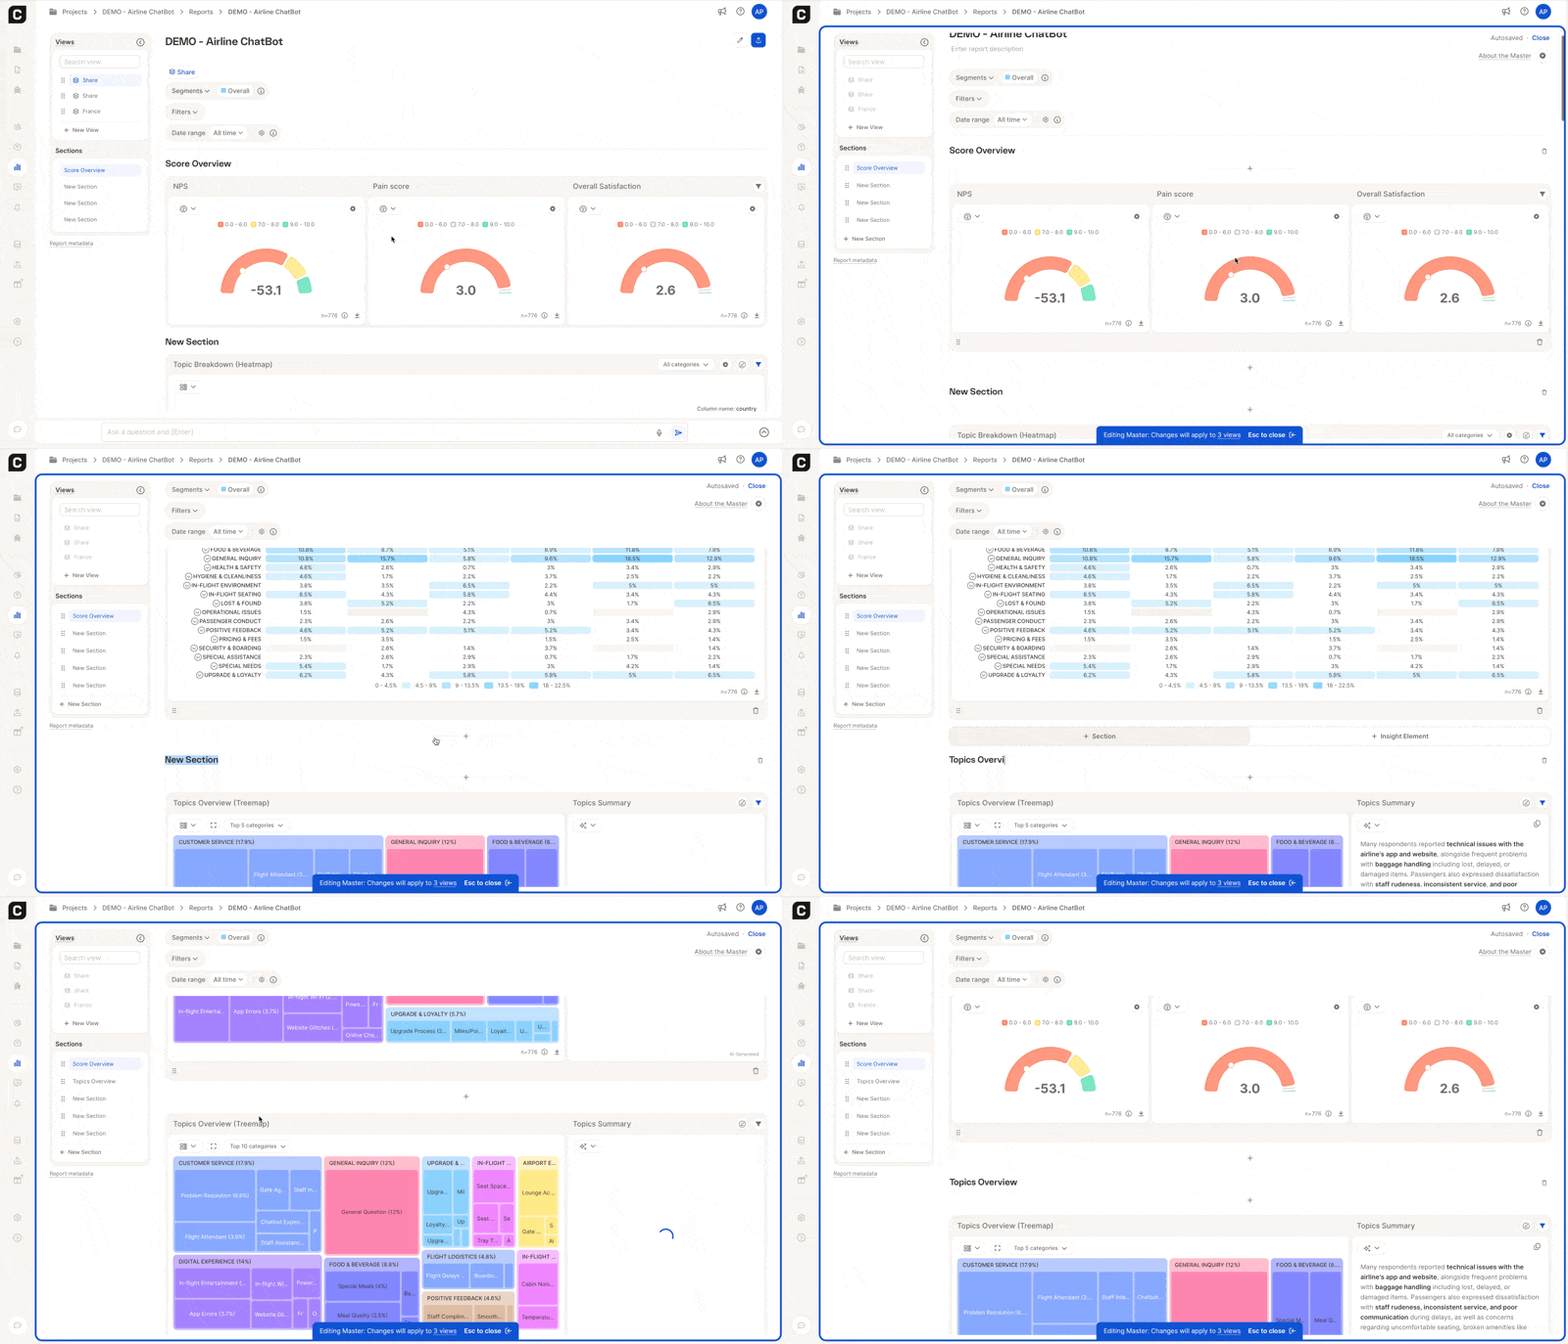
- In Edit Mode, click + Add New Section.
- Give your section a name (e.g., “NPS Breakdown”, “Sentiment by Product”).
- Add visualizations, summaries, or custom text.
- Better Organization — Keep related insights grouped together.
- Improved Readability — Help readers focus on one topic at a time.
- Drag-and-Drop Order — Rearranging sections is as simple as dragging them in the side panel.
Insight Elements: Visualize What Matters
Insight Elements are pre-built components that let you analyze and display your data in a powerful, digestible format.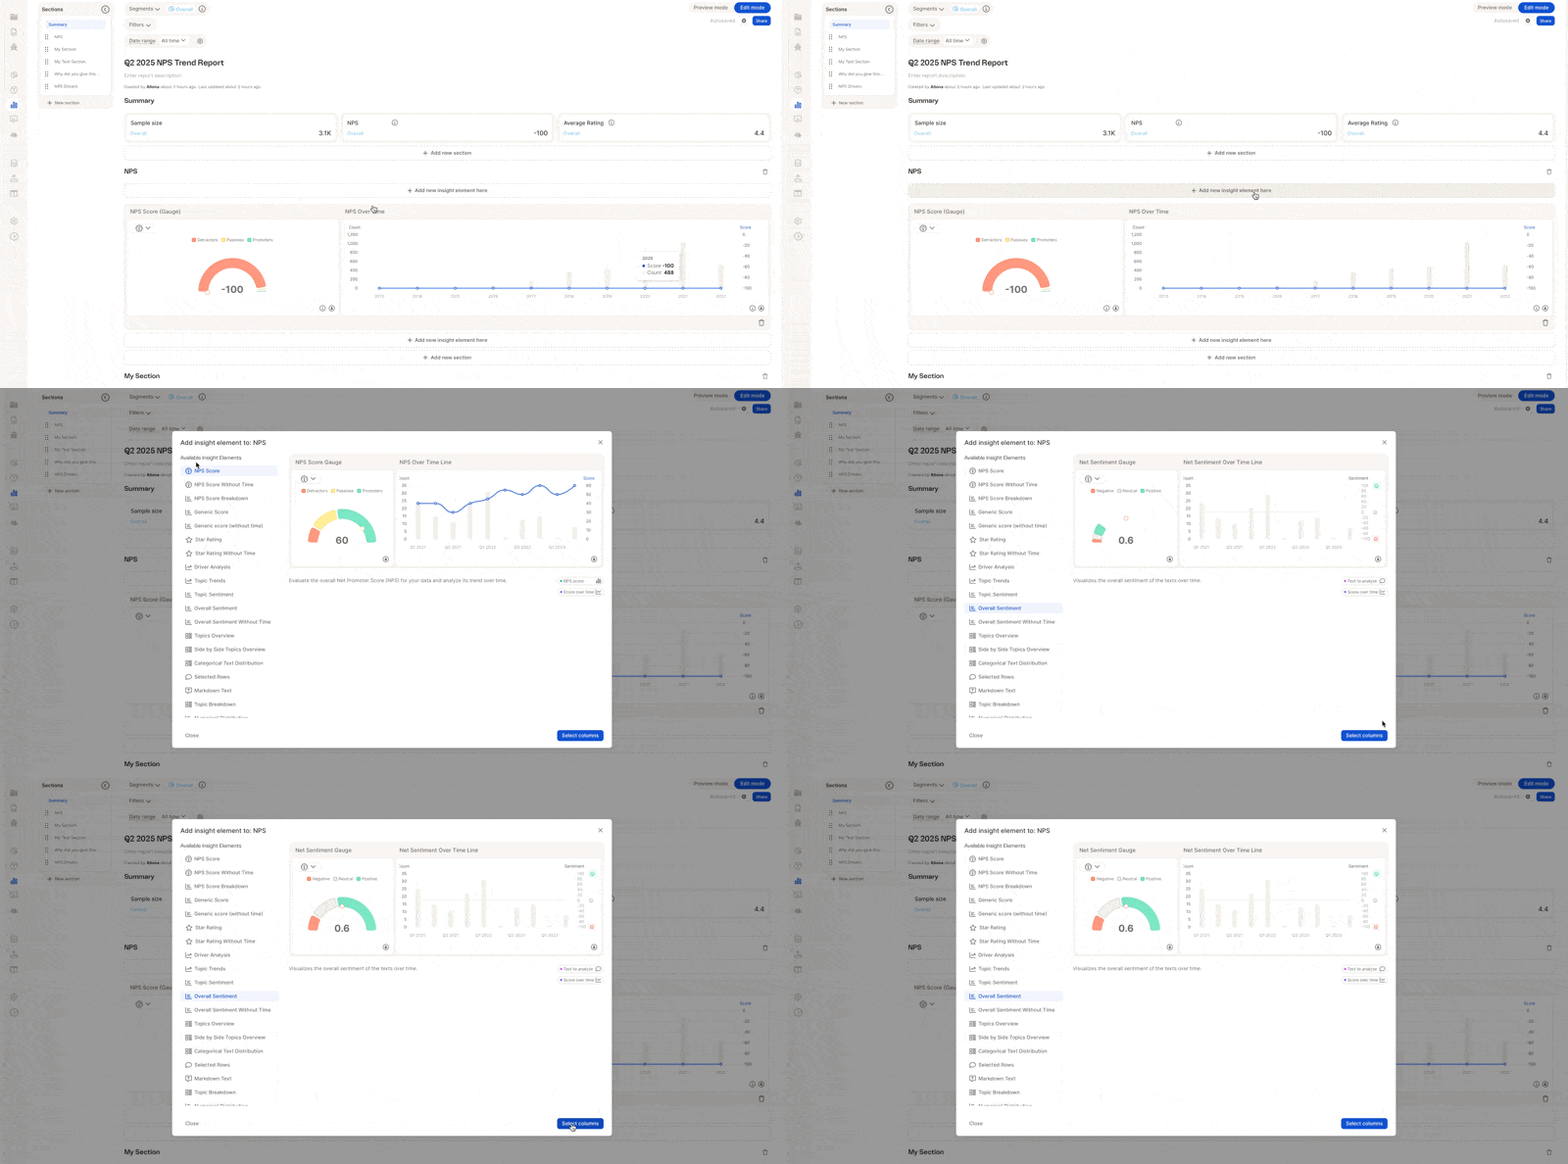
- NPS & Ratings — Show Net Promoter Scores, star ratings, and score distributions.
- Trends & Drivers — Reveal what’s impacting sentiment over time.
- Sentiment Analysis — Show overall or category-specific sentiment.
- Topic Insights — Break down feedback into themes or categories.
- In Edit Mode, choose an insight type from the left panel.
- Review its preview and purpose.
- Click Select Columns to map the correct data fields.
- The insight will be added to the current section.
Filters, Segments & Date Ranges
Once the structure is in place, you control which data the report shows with filters and date ranges, and compare groups side by side with segments.Filters, segments & views
Create filters, date ranges, and segments, save them in views, compare brands or regions, and solve common tasks like sharing a report filtered to one team.