

How Is the Net Sentiment Score Calculated?
The formula is simple:Net Sentiment Score = % Positive – % NegativeThis results in a score ranging from:
- +100 → all responses are positive
- 0 → equal balance between positive and negative
- –100 → all responses are negative
🔴 A lower score suggests a predominance of negative sentiment
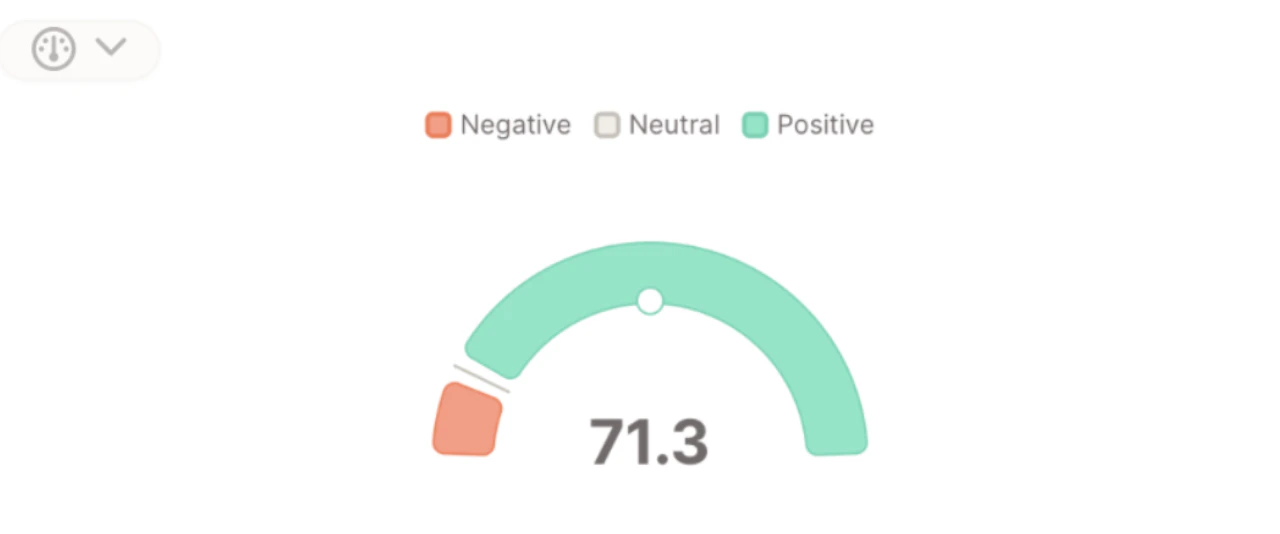
- 84.5% of comments are classified as positive
- 13.2% are negative
84.5 – 13.2 = 71.3
Visualizing Net Sentiment
There are two ways to visualize Net Sentiment in Caplena using Insight Elements:1. Net Sentiment (Gauge + Summaries)
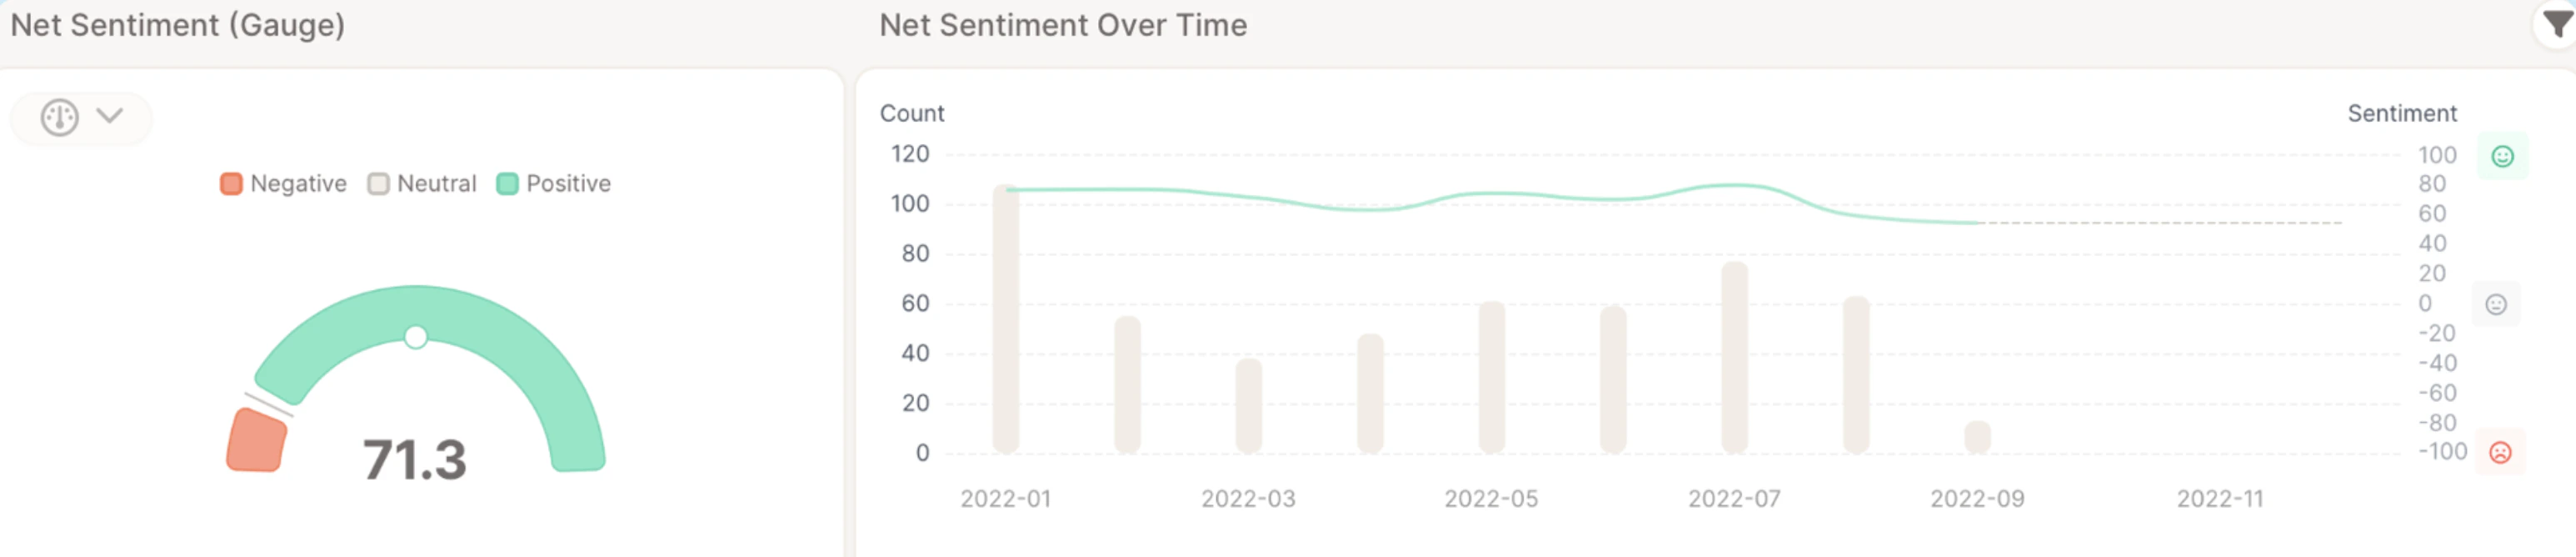
- A gauge displaying the current score
- An AI-generated Positive Sentiment Summary
- An AI-generated Negative Sentiment Summary
Best for one-time reports, dashboard overviews, and highlighting what customers like or dislike.
2. Net Sentiment Over Time
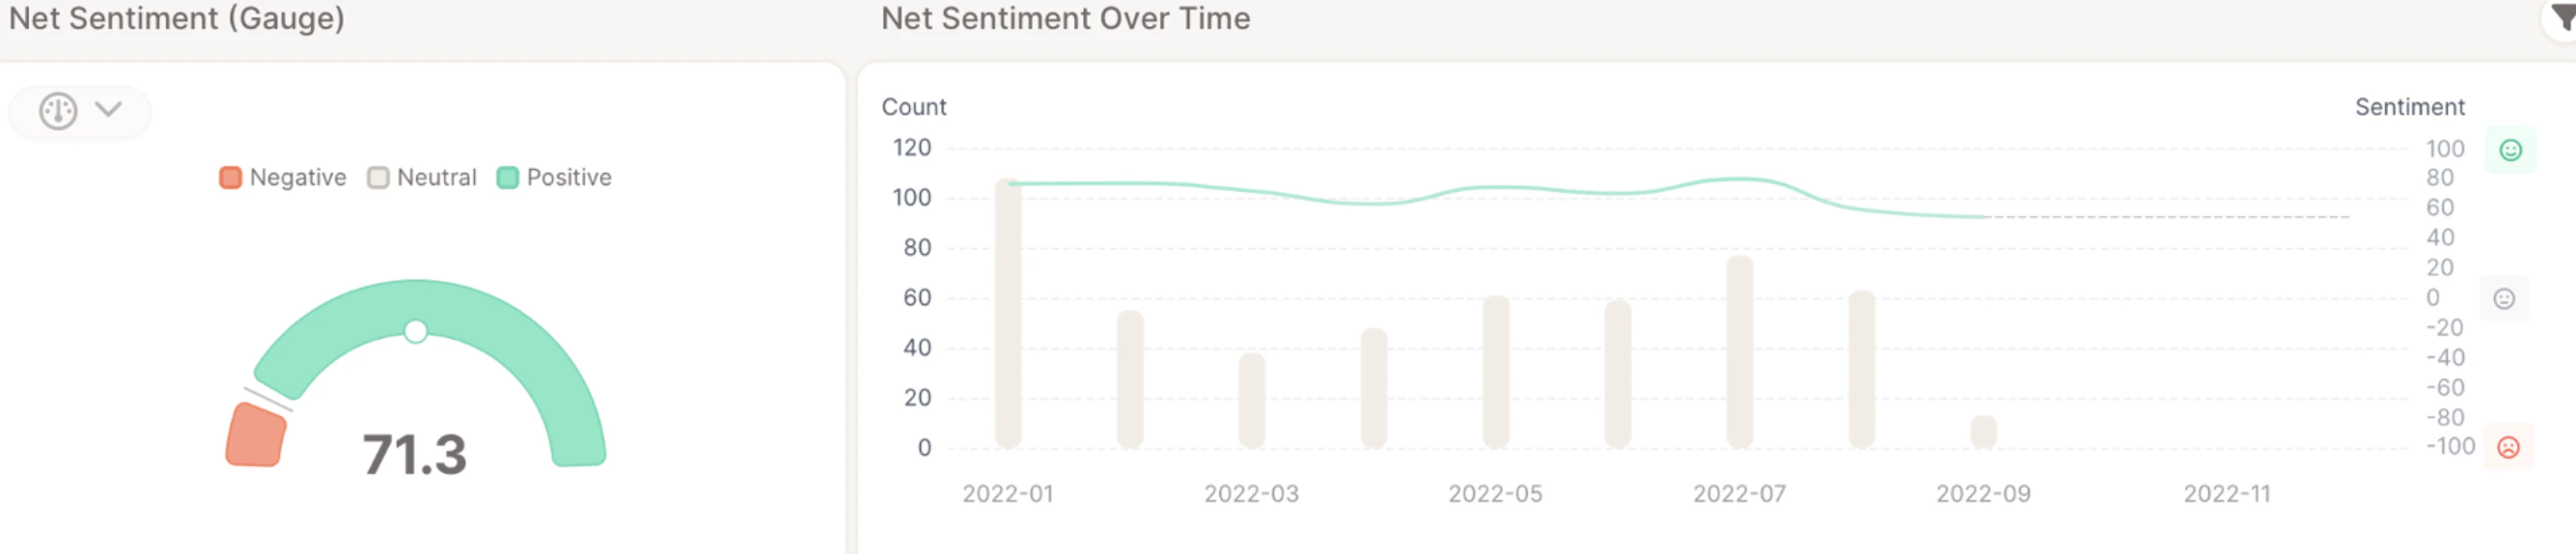
- A gauge displaying the current score
- A line chart showing how sentiment changes over time
Best for tracking sentiment development over time or identifying turning points in customer perception.
Choosing the Period for the Gauge
For both views, you can control which period the gauge (and any sentiment summary number) reflects using the Displayed timeframe option:- Most recent period (default) – the gauge shows net sentiment for the most recent time bucket in the report’s date range. Use this when the headline should track the latest state of sentiment.
- Entire period – the gauge shows net sentiment averaged across the full date range. Use this for a stable benchmark.
Use Cases
Use the Net Sentiment Score to:- Benchmark overall customer sentiment
- Track emotional tone over time (with date variable)
- Supplement or replace metrics like NPS or CSAT