

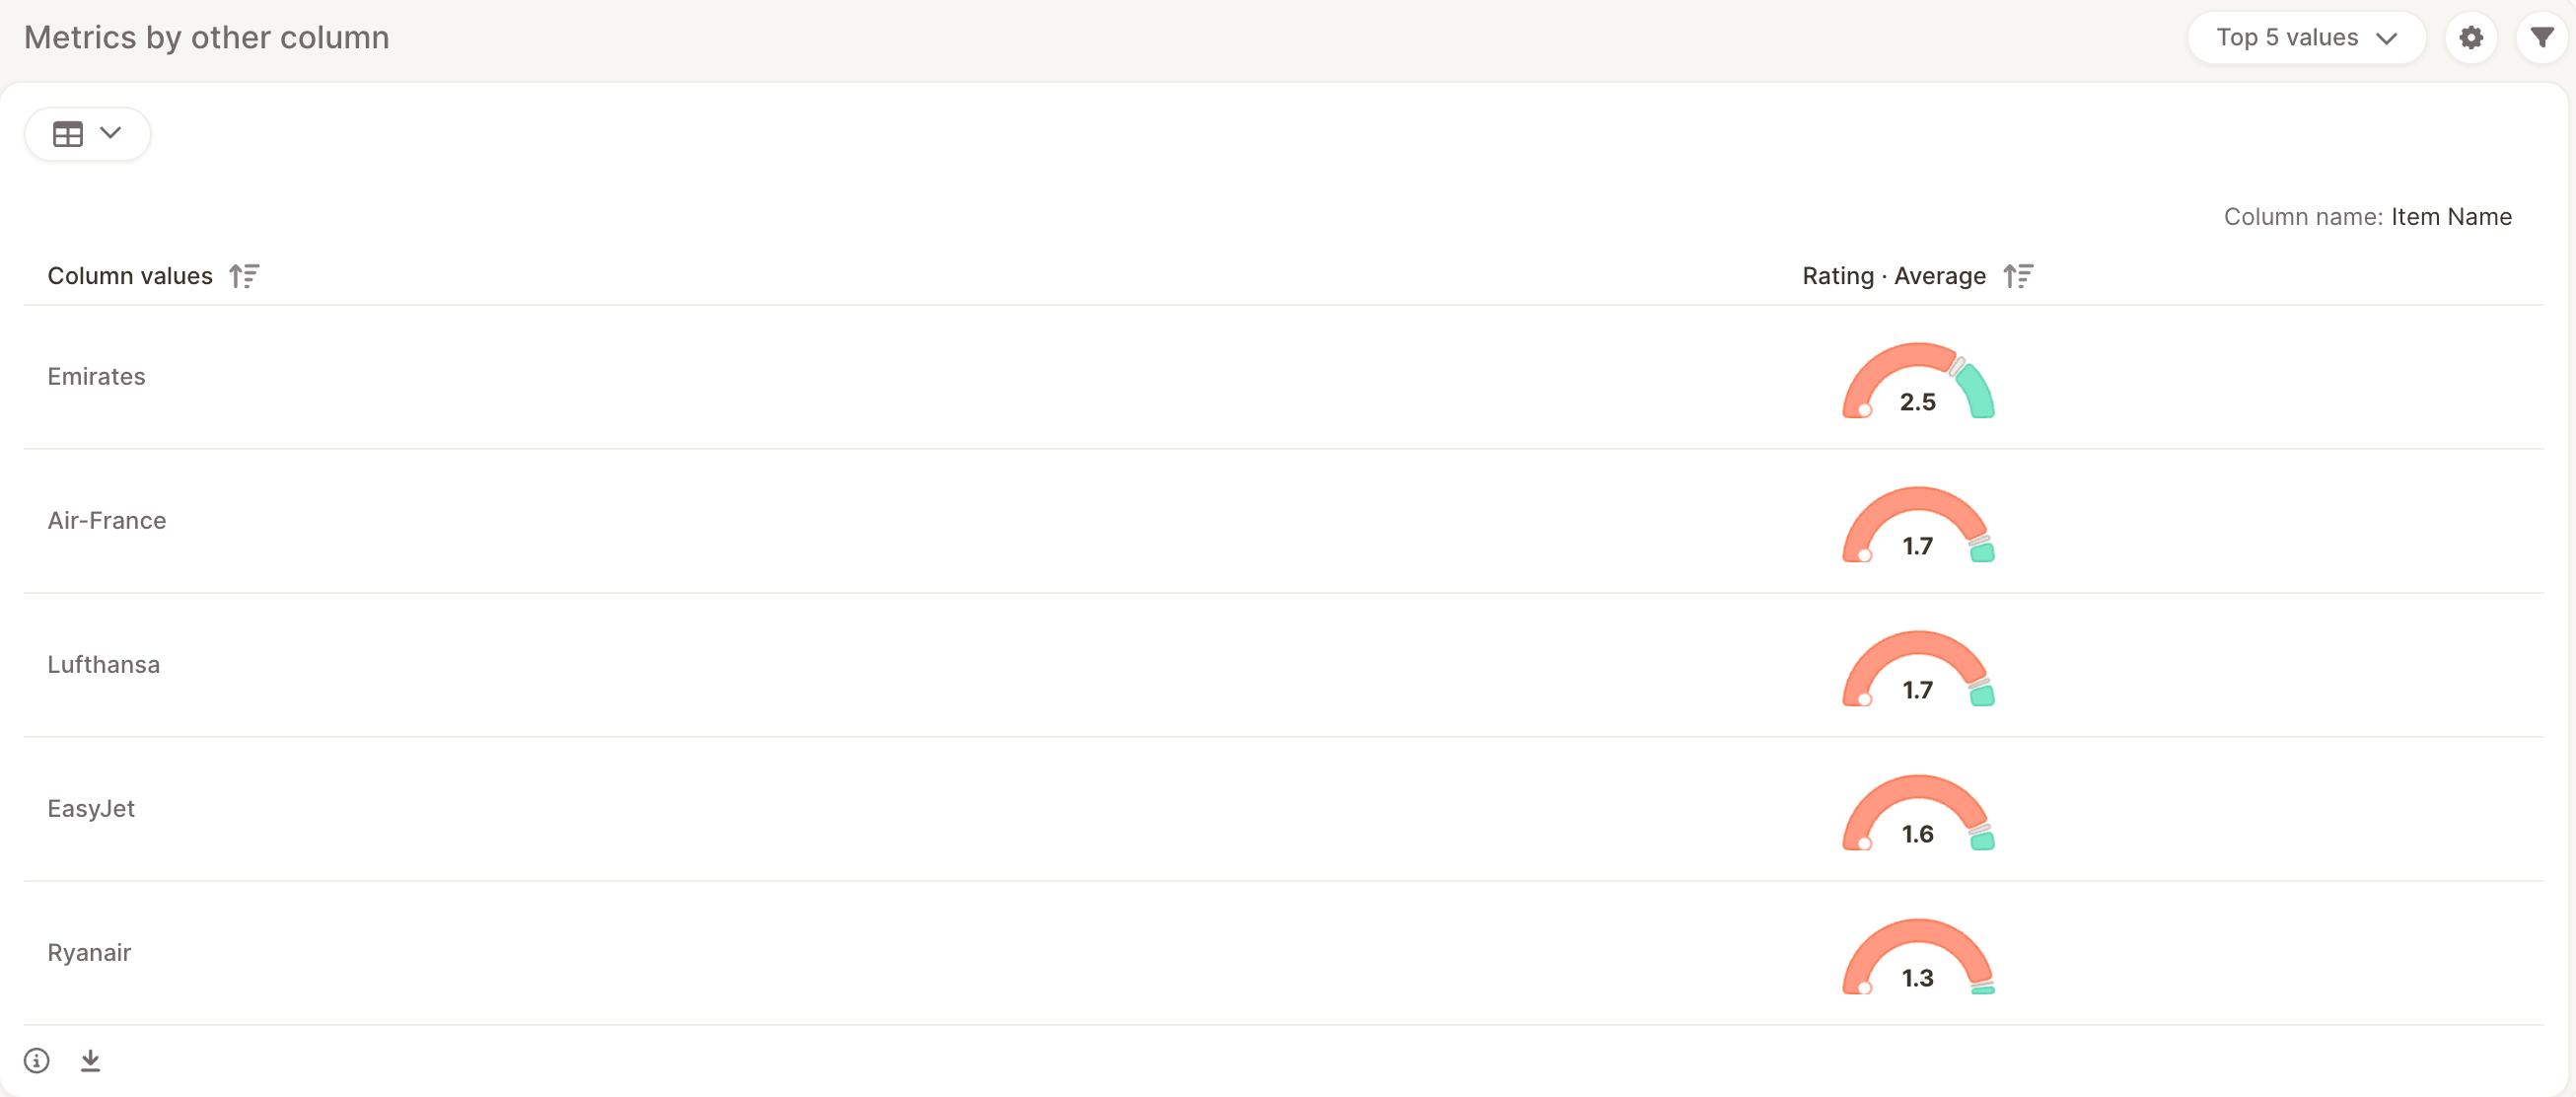
When to use it
Use this element when you want to answer questions like:- Which region has the best NPS, and does its feedback also have the highest net sentiment?
- How do brands compare on satisfaction score, star rating, and net sentiment at the same time?
- Which store has the most responses, and how does it score on each metric?
Add the element
- In the Report Master, click + Add new insight element here.
- Choose Metrics by other column.
- Under Breakout column, select the column whose values become the rows of the element, for example Country or Brand.
- Under Values, select the columns to measure. Use the + button to add more values. You can add up to 8 values in total:
- Up to 5 Text to analyze columns
- Up to 5 numerical columns
Metrics and score styles
Each value shows one metric. Open the element’s settings to change the metric and how it’s displayed.
By default, Text to analyze columns show net sentiment when the column has topics with sentiment enabled. Choosing Stars & Number displays the column’s average as a star rating.
The element also shows Mentions, the number of responses for each breakout value.
Table and tiles views
Switch between two views using the widget dropdown:- Table: One row per breakout value and one column per metric, with a TOTAL row for all responses. Click a column header to sort.
- Tiles: A grid with one row per metric and one column per breakout value, plus a TOTAL column.